Recognizing Paired Data
Introduction
Welcome to Seeing Relationships in Data, the first course in this learning path! This is the first lesson out of seven, so we are right at the starting line. In this course, you will learn how to spot and describe relationships between two variables using visual and numerical tools. But before you can analyze relationships, you need to recognize the kind of data that makes those analyses possible. That is exactly what this lesson is about: recognizing paired data.
Why Two Numbers Together Tell a Story
Imagine you run a small coffee shop. At the end of each day, you write down two things: the high temperature outside that day and the number of iced coffees sold. After a few weeks, you have a collection of days, and for each day you have two numbers sitting side by side. Neither number means much on its own for spotting a trend, but together they might reveal something interesting — like whether hotter days tend to be associated with higher iced coffee sales.
This idea of recording two measurements on the same individual or case is the foundation of everything we will study in this course. Before you can create scatter plots and describe the patterns you see, you first need to be sure your data has this special structure. Let's look at exactly what that structure requires.
What Makes Data "Paired"
Data is paired when three conditions are met:
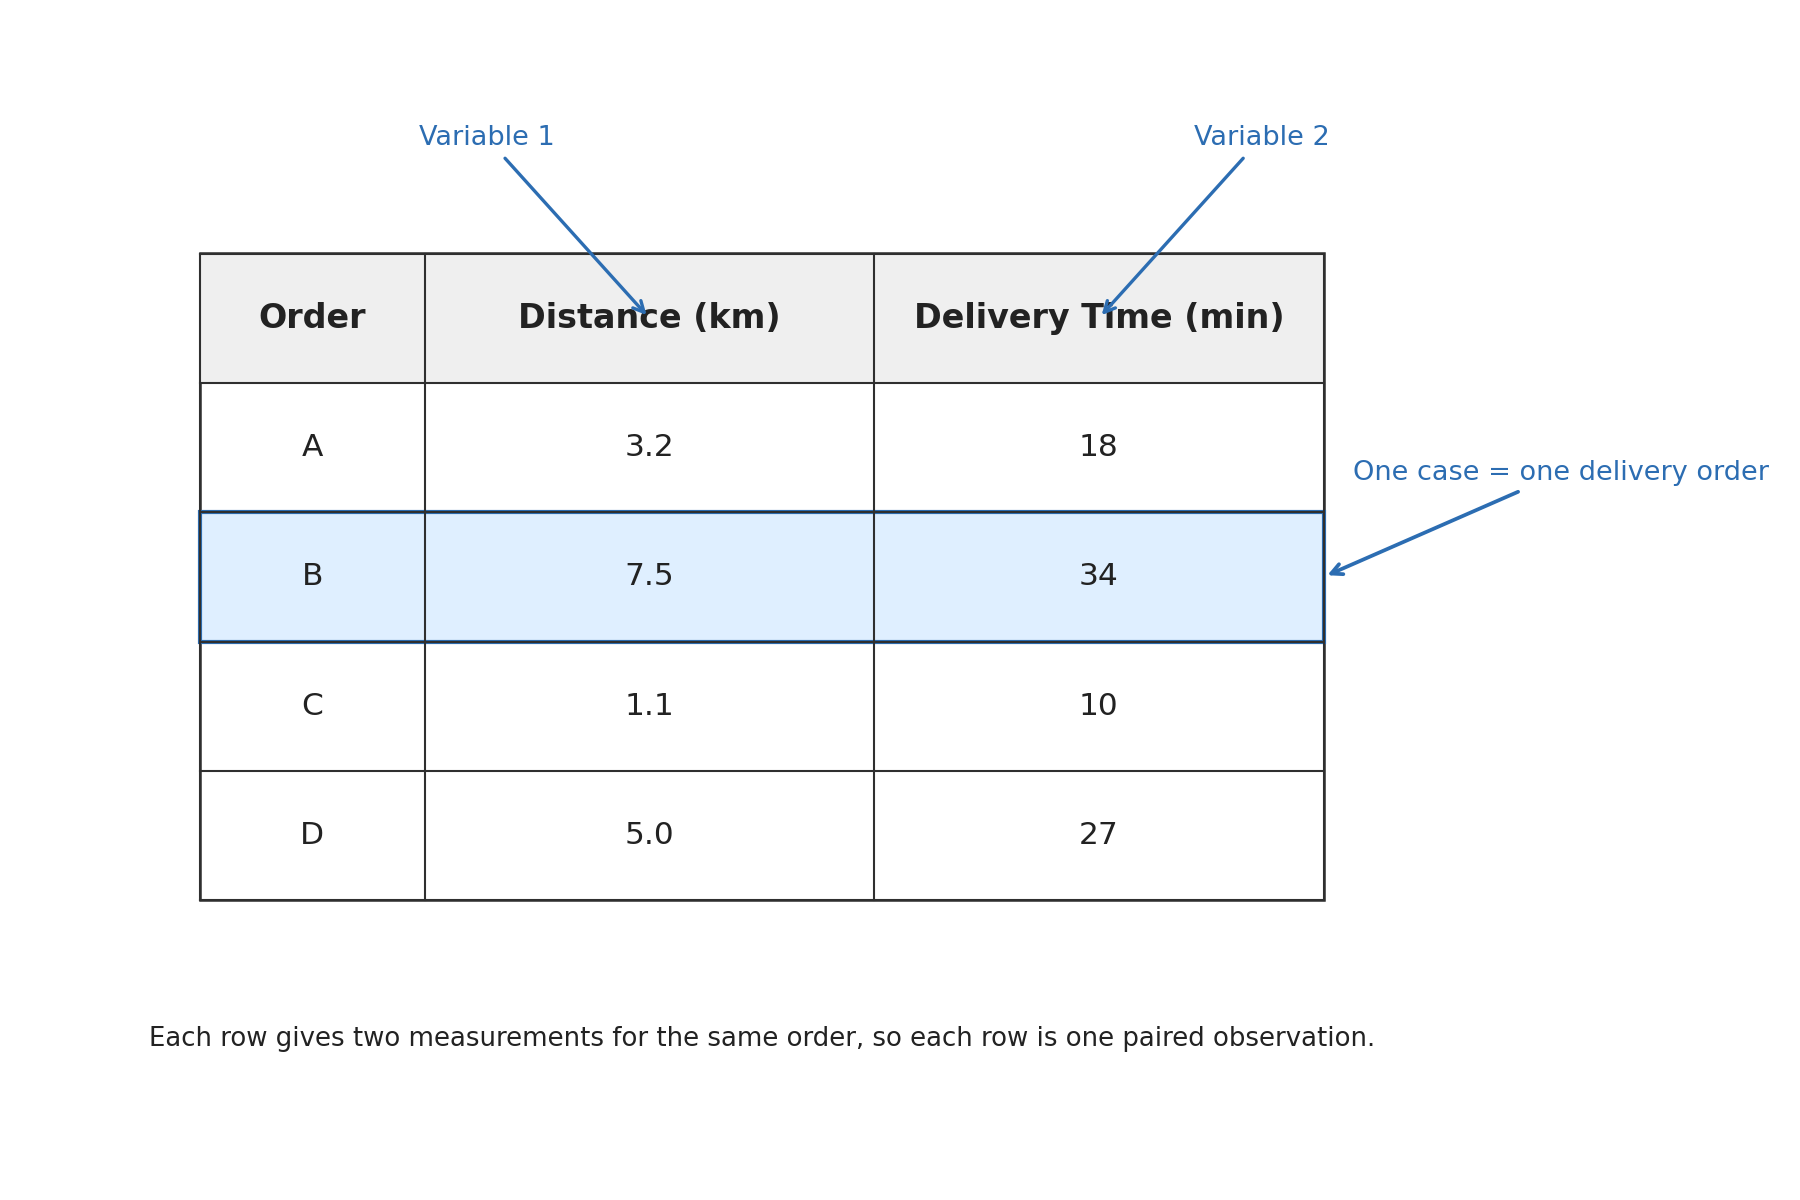
- There is a collection of individual cases — people, days, cities, products, or any other units you are studying.
- Two quantitative variables (numeric measurements) are recorded for each case.
- Each case's two measurements are linked by belonging to that same case.
For example, suppose a teacher records each student's study time (in hours) and exam score (in points). Each student is one case, and the two variables are study time and exam score. Because both numbers come from the same student, they are genuinely paired.
The key word here is same. The two measurements must come from the same person, the same event, the same object — whatever the case happens to be. If someone shuffled the rows so that each student's study time was matched with a random other student's exam score, the pairing would be destroyed and any analysis of the relationship between the two variables would be meaningless.