Reshaping and Flattening Arrays
Introduction
Welcome to Reshaping, Joining, and Copying NumPy Arrays. We’re starting the course with a practical way to turn long sequences of values into useful table shapes. In this lesson, we’ll reshape arrays using explicit dimensions or let NumPy infer one with -1. We’ll also make a one-column table, check what to do when values do not fit evenly, and use flatten() to return a table to one dimension.
Reshape a 1D Array Into a Table With Explicit Sizes
A one-dimensional array can hold all our readings, but a table can make groups and rows easier to see. With reshape(rows, cols), we choose the new number of rows and columns. NumPy places values in order, filling each row before moving to the next. The new shape must use every value exactly once, so the number of values must equal rows × cols.
Here, six readings fill two rows with three values each. The printed table makes the row-by-row order visible:
If we request a shape that needs more or fewer than six values, NumPy raises a ValueError. Reshaping changes the arrangement, not the amount of data.
Let NumPy Infer a Dimension With -1
We do not always need to calculate both dimensions ourselves. When one dimension is -1, NumPy infers it from the number of values and the other dimension. Continuing inside main(), we can give the row count as 3; six values then require two columns. The same idea works for twelve values with four columns: reshape(-1, 4) gives three rows.
NumPy infers two columns because . The output shows that the readings still fill rows in their original order:
The dimensions must still divide the total size evenly. For example, six values cannot fit into reshape(4, 2), which requires eight values, so that request raises a ValueError.
Make a One-Column Table With reshape(-1, 1)
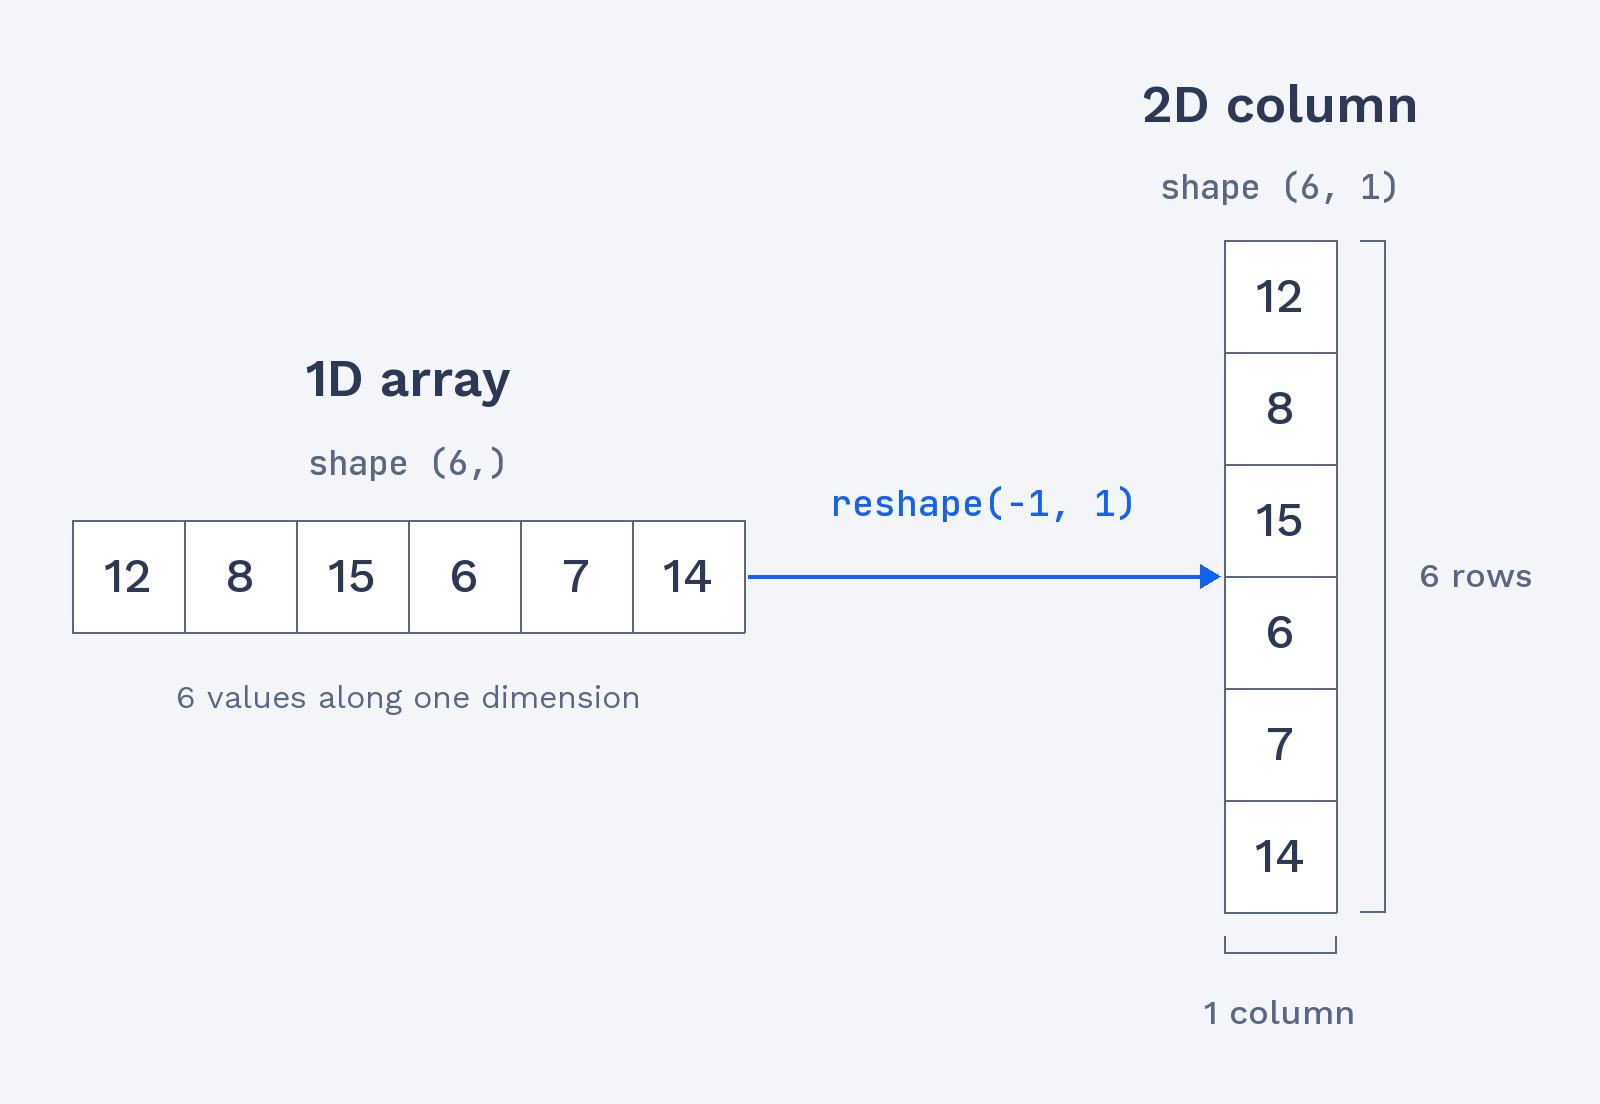
A one-dimensional array with six values has shape (6,). To arrange those values as six rows in a single column, use reshape(-1, 1): NumPy infers the row count and uses one column. A two-dimensional column can be useful when an operation expects table-shaped data rather than a plain 1D sequence.
The shape output compares the original array with the new column:
The first shape describes one dimension containing six values. The second describes two dimensions: six rows by one column. As we work with tables in later lessons, keeping that distinction in mind will help us choose a suitable shape.
The comparison below shows the same six values as a 1D sequence and as a two-dimensional column.