What a Distribution Represents
Introduction
Welcome to Reading and Describing Distributions! This is the first lesson of the course, and it will help you build a strong, intuitive understanding of how distributions are represented and described. No prerequisite math is needed, so you can jump right in.
In this lesson, we will explore what a probability distribution actually represents. By the end, you will understand why describing a situation with a single number, like an average, is not enough, and why we need something richer to capture what is really going on. Let's dive in.
Things Vary, and That Matters
Think about a familiar situation: your morning commute. Some days it takes 20 minutes, other days 35, and occasionally 50. If someone asks, "How long is your commute?" you might answer with a single number, say 30 minutes. But that one number hides a lot of detail — it does not tell us how often the trip takes 20 minutes versus 45 minutes.
Quantities that can take on different values each time we observe them are called varying quantities (or variables). The commute time varies. The number of emails you receive each day varies. The wait time at a coffee shop varies. Whenever something varies, there is a pattern hiding behind all those different outcomes, and a probability distribution is the tool that reveals it.
The Problem with a Single Summary
Suppose a city bus company reports that, on average, its bus arrives 6 minutes late. That sounds informative, but consider two very different realities that could produce the exact same average:
- Reality A: The bus is almost always between 5 and 7 minutes late. The experience is predictable.
- Reality B: The bus is on time half the days and 12 minutes late the other half. The experience is wildly inconsistent.
Both realities share the same average of 6 minutes, yet the day-to-day experience is completely different. An average compresses all outcomes into one value, and in doing so, it throws away information about how those outcomes are spread out and how likely each one is. To truly understand what is happening, we need to see the full picture.
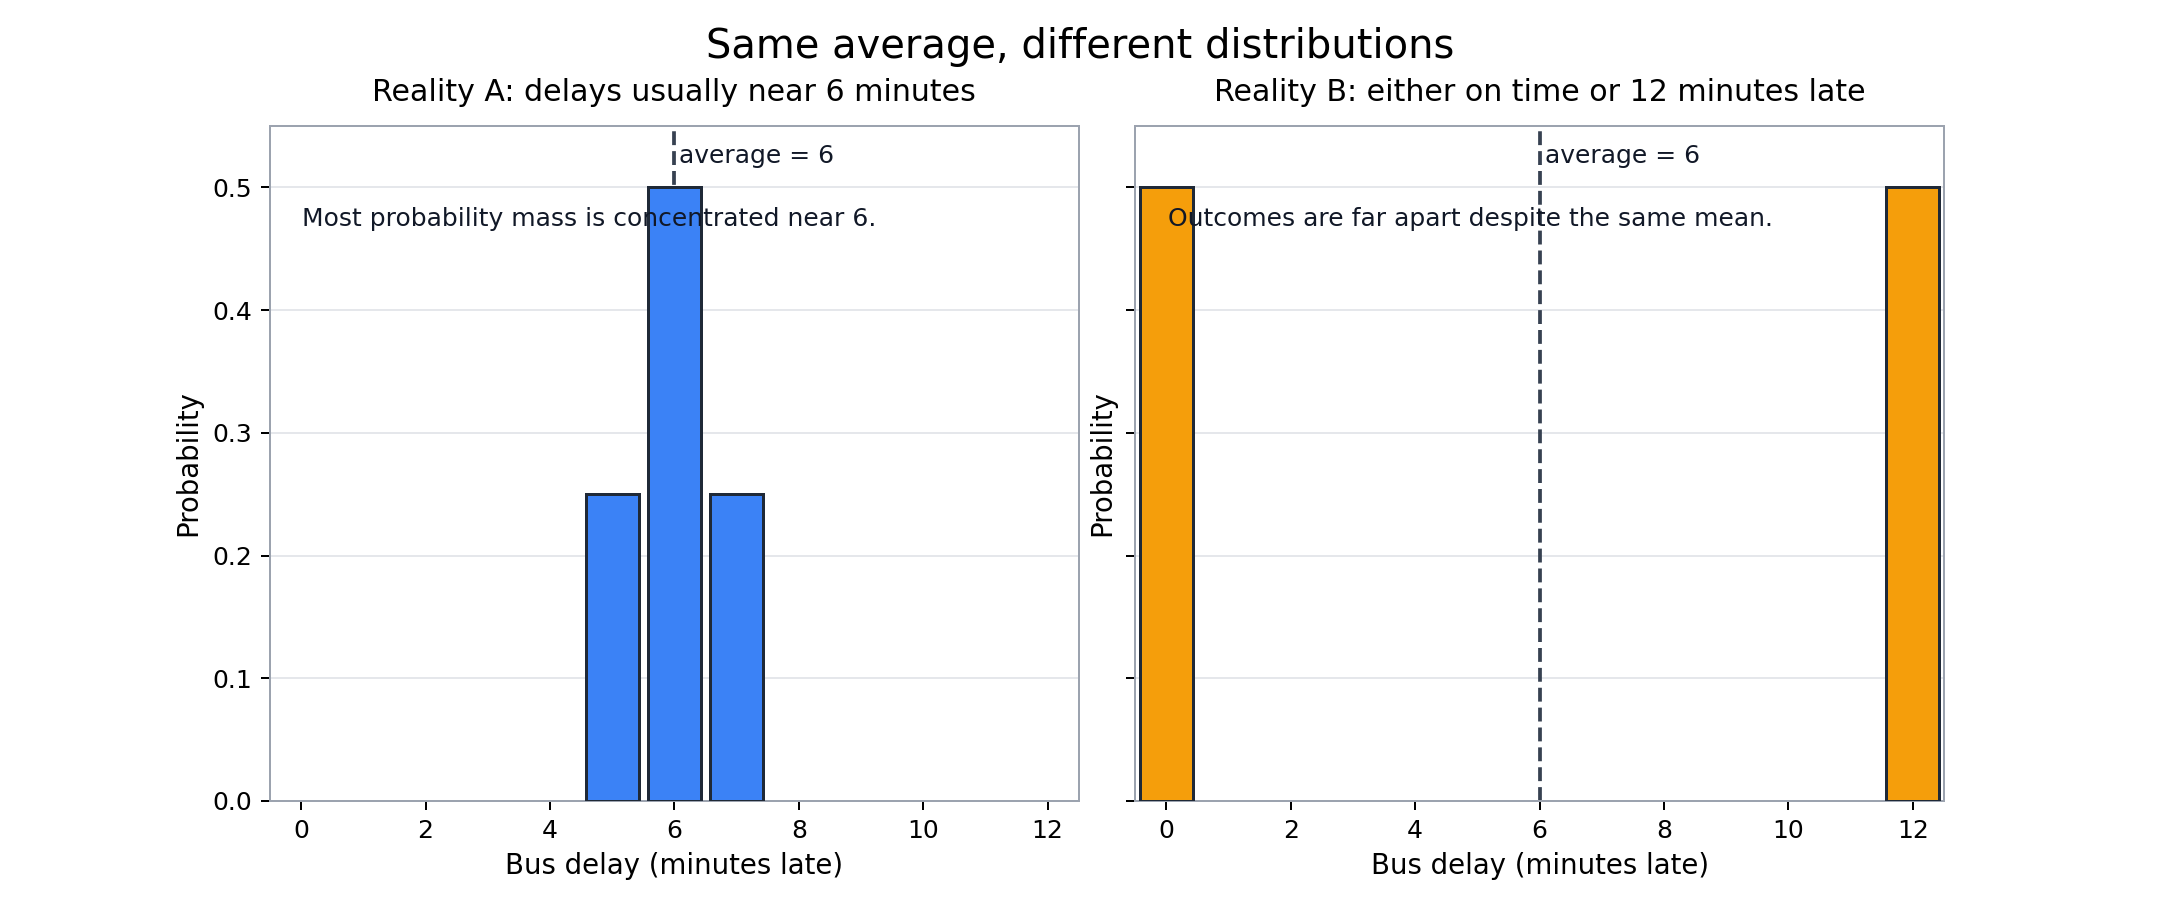
The figure above shows exactly this idea. Two distributions can look completely different — one narrow and clustered, the other split into two groups — while still sharing the same average. The shape of the distribution is what tells the real story.