Judging Distribution Spread
Introduction
Welcome back to Reading and Describing Distributions! This is the fifth and final lesson, so you are wrapping up the course — nice work keeping that momentum going. In the previous lessons, you learned what a distribution represents, how to read its graph, how to distinguish counted outcomes from measured ones, and how to locate a distribution's center. The center tells us where typical values live, but it leaves an important question unanswered: how tightly packed or loosely scattered are the outcomes around that center? In this lesson, you will learn to judge the spread of a distribution, compare spreads across distributions, and connect wider spread to less consistent, less predictable results.
Two Commuters, Same Center, Different Stories
Imagine two coworkers, Alex and Jordan, who both report an average commute of about minutes. If all we know is that center, their daily experiences sound identical. But suppose Alex's commute almost always falls between and minutes, while Jordan's ranges anywhere from to minutes. Their typical value is the same, yet the variability around that value is wildly different — Alex can plan an arrival with confidence, but Jordan cannot.
This simple scenario shows why center alone is not enough. We also need to describe how much the outcomes spread out on either side of that center. That quality — the width of the region where outcomes realistically land — is what we call the spread of a distribution.
What Spread Looks Like on a Graph
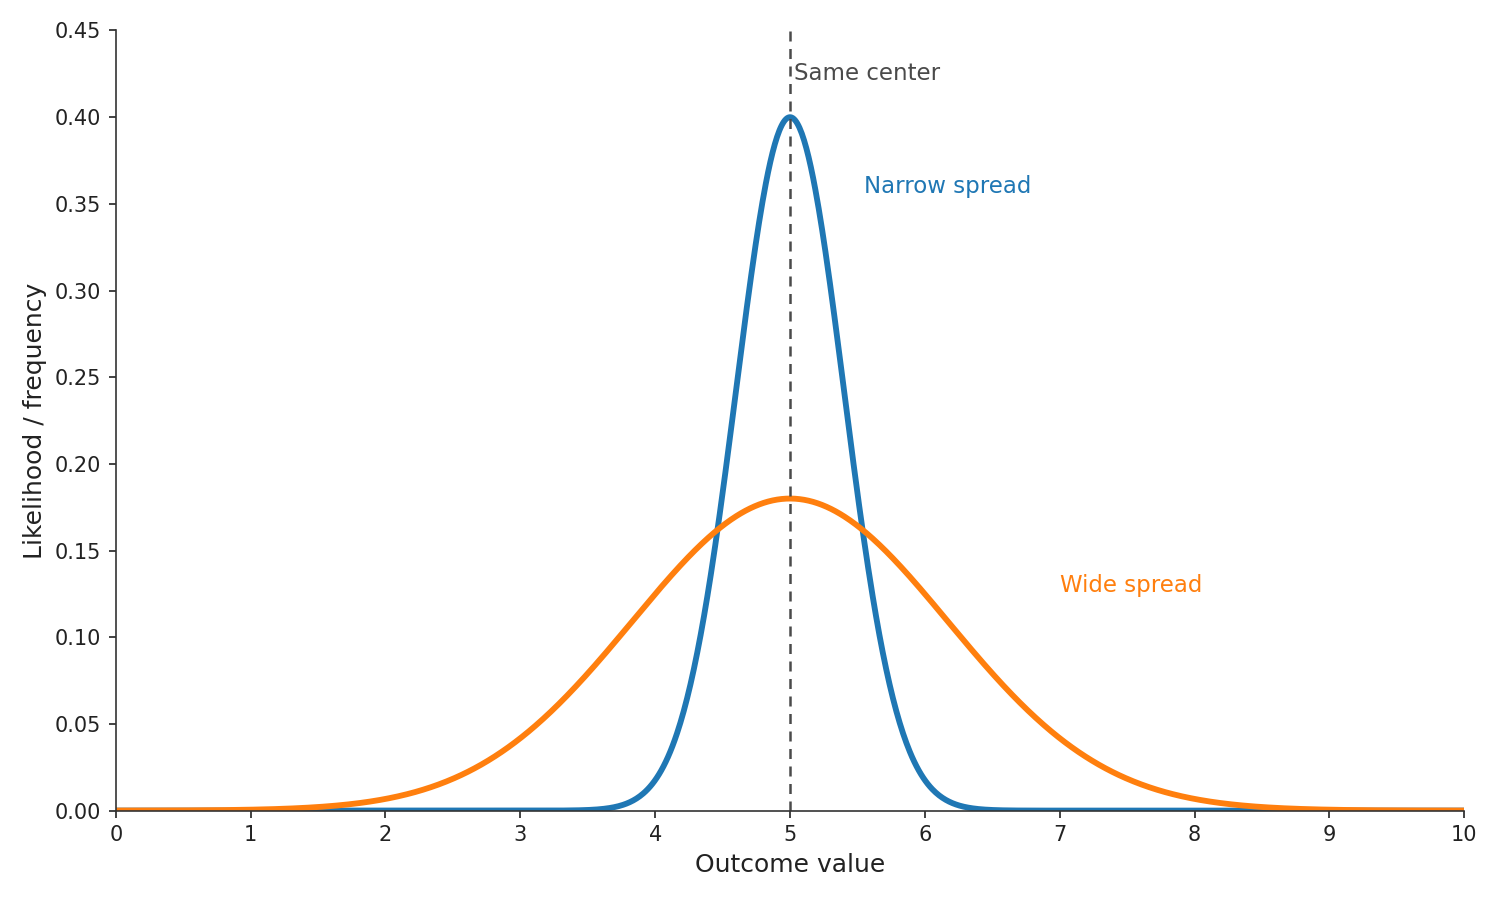
On a distribution graph, spread shows up as the horizontal width of the area where most of the distribution's weight sits. A narrow distribution rises steeply near its center and drops off quickly, packing almost all outcomes into a small stretch of the horizontal axis. A wide distribution is lower and stretches further in both directions, placing meaningful likelihood over a much larger range of outcome values.
Here is a quick way to judge spread at a glance:
- Look at where the distribution effectively starts and effectively ends along the horizontal axis — the points beyond which the height is nearly zero.
- The distance between those two points gives you a rough sense of the distribution's spread.
- A distribution that covers a short stretch is tightly clustered; one that covers a long stretch is widely spread.
Remember that spread is always about the horizontal axis, not the vertical one. The horizontal axis carries outcome values; the vertical axis shows likelihood or frequency. So a distribution that is tall and skinny is narrow in spread, while one that is short and wide is broad in spread — even though the short, wide shape may look "smaller" at first glance.