Trusting Regression Predictions
Introduction
Welcome to the fifth and final lesson of Reading and Using Regression Lines! Over the course of this unit, you have built a strong toolkit: interpreting slopes and intercepts, computing predicted values, and distinguishing interpolation from extrapolation. Now we bring all of these skills together around one central question: how much should we actually trust a given prediction?
In this lesson, we will identify five key factors that influence the credibility of a regression prediction and assemble them into a practical checklist you can apply to any scenario.
From Classification to Judgment
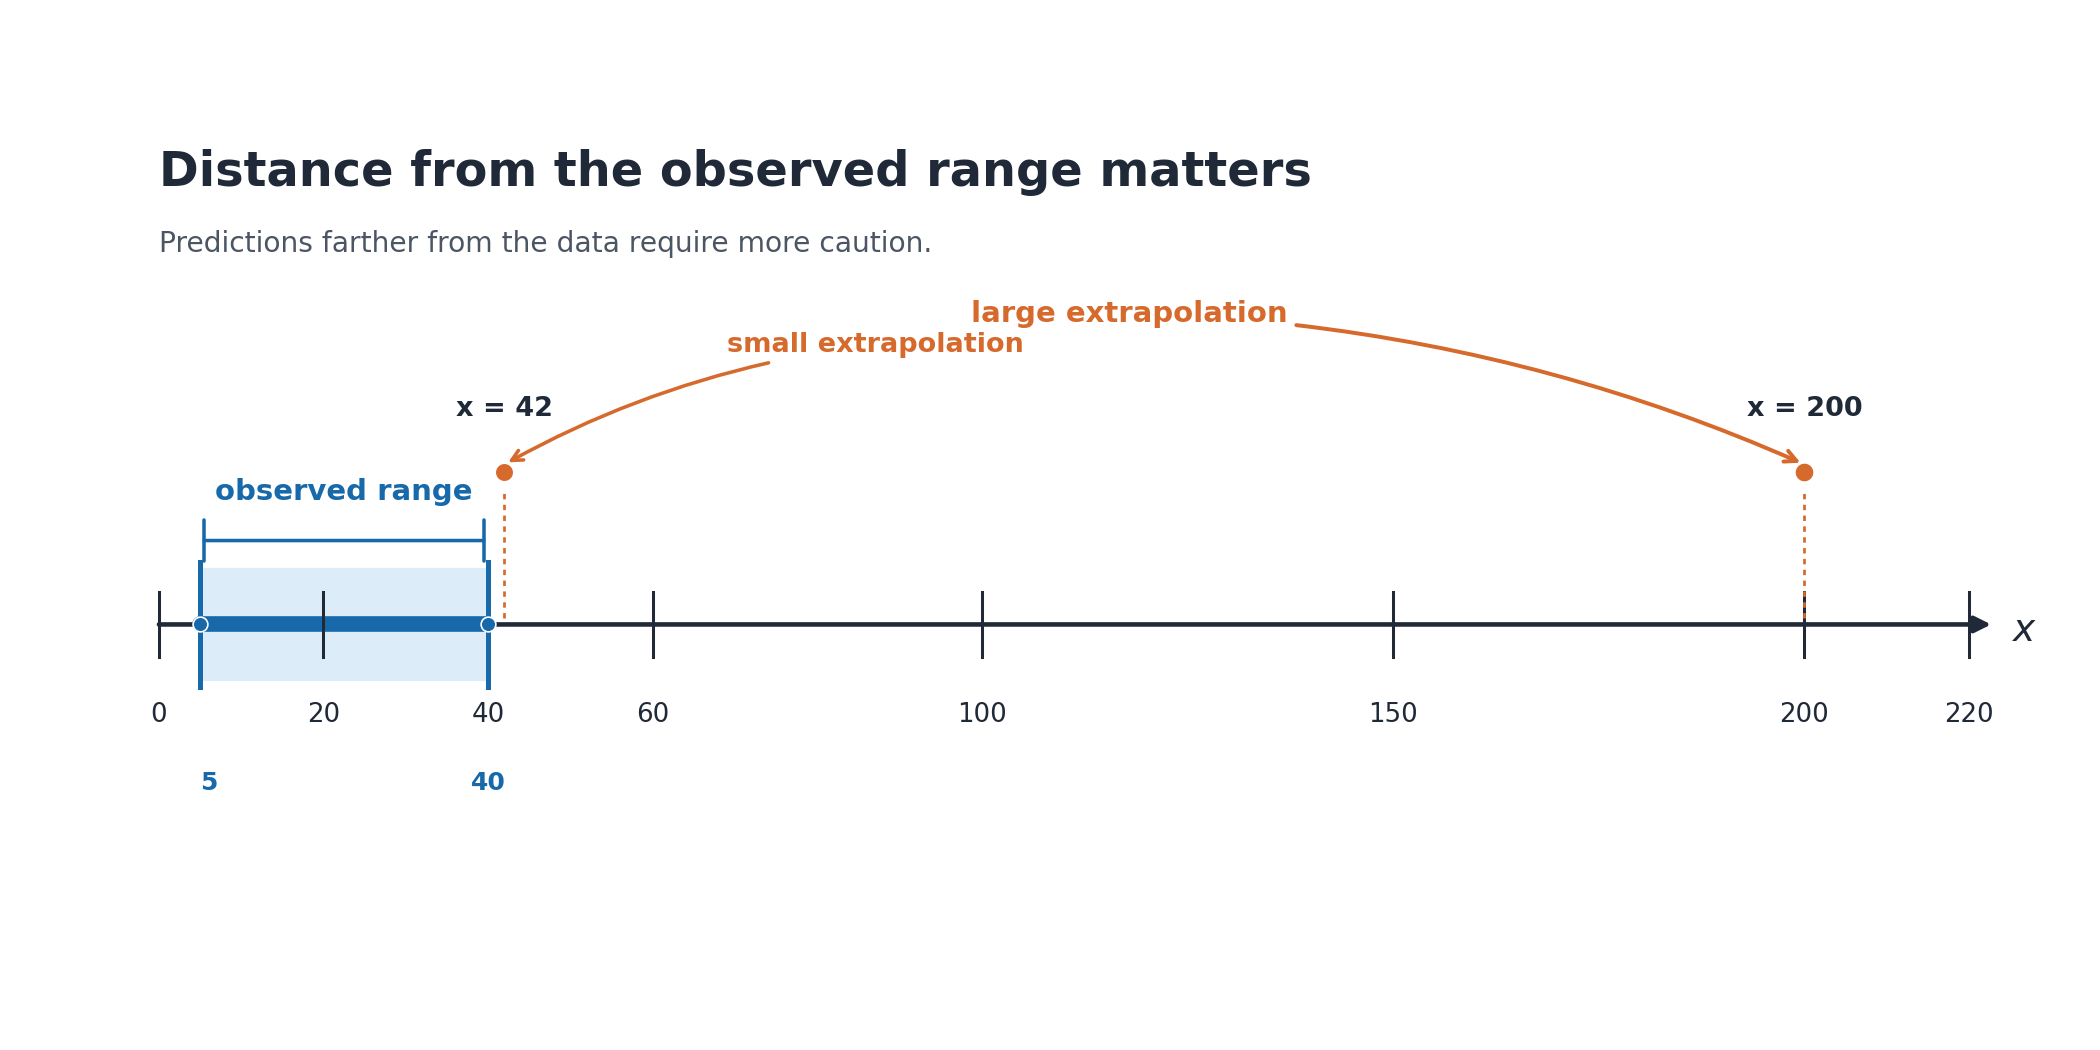
In the previous lesson, we learned to classify predictions as interpolation or extrapolation. That distinction is valuable, but it is only one piece of the puzzle. Even a prediction that falls inside the observed range can be unreliable if the underlying data is weak or messy. On the other hand, an extrapolation just barely past the boundary might still be quite reasonable if the fit is strong and the pattern is clearly linear.
Judging the trustworthiness of a prediction requires looking at the full picture, weighing multiple factors rather than relying on a single criterion. Let's walk through each factor one at a time, then combine them into a checklist.
Strength of the Association
From the earlier course on correlation, you know that the correlation coefficient measures how tightly the data points cluster around the overall trend. A value of near indicates a strong linear association, while a value near indicates a weak one.
When the association is strong, the regression line does a good job summarizing the data, and predictions tend to land close to reality. When the association is weak, the points scatter loosely around the line, and any single prediction carries much more uncertainty. As a practical rule, the closer is to , the more confidence we can place in a prediction from that model.
Linear Form of the Relationship
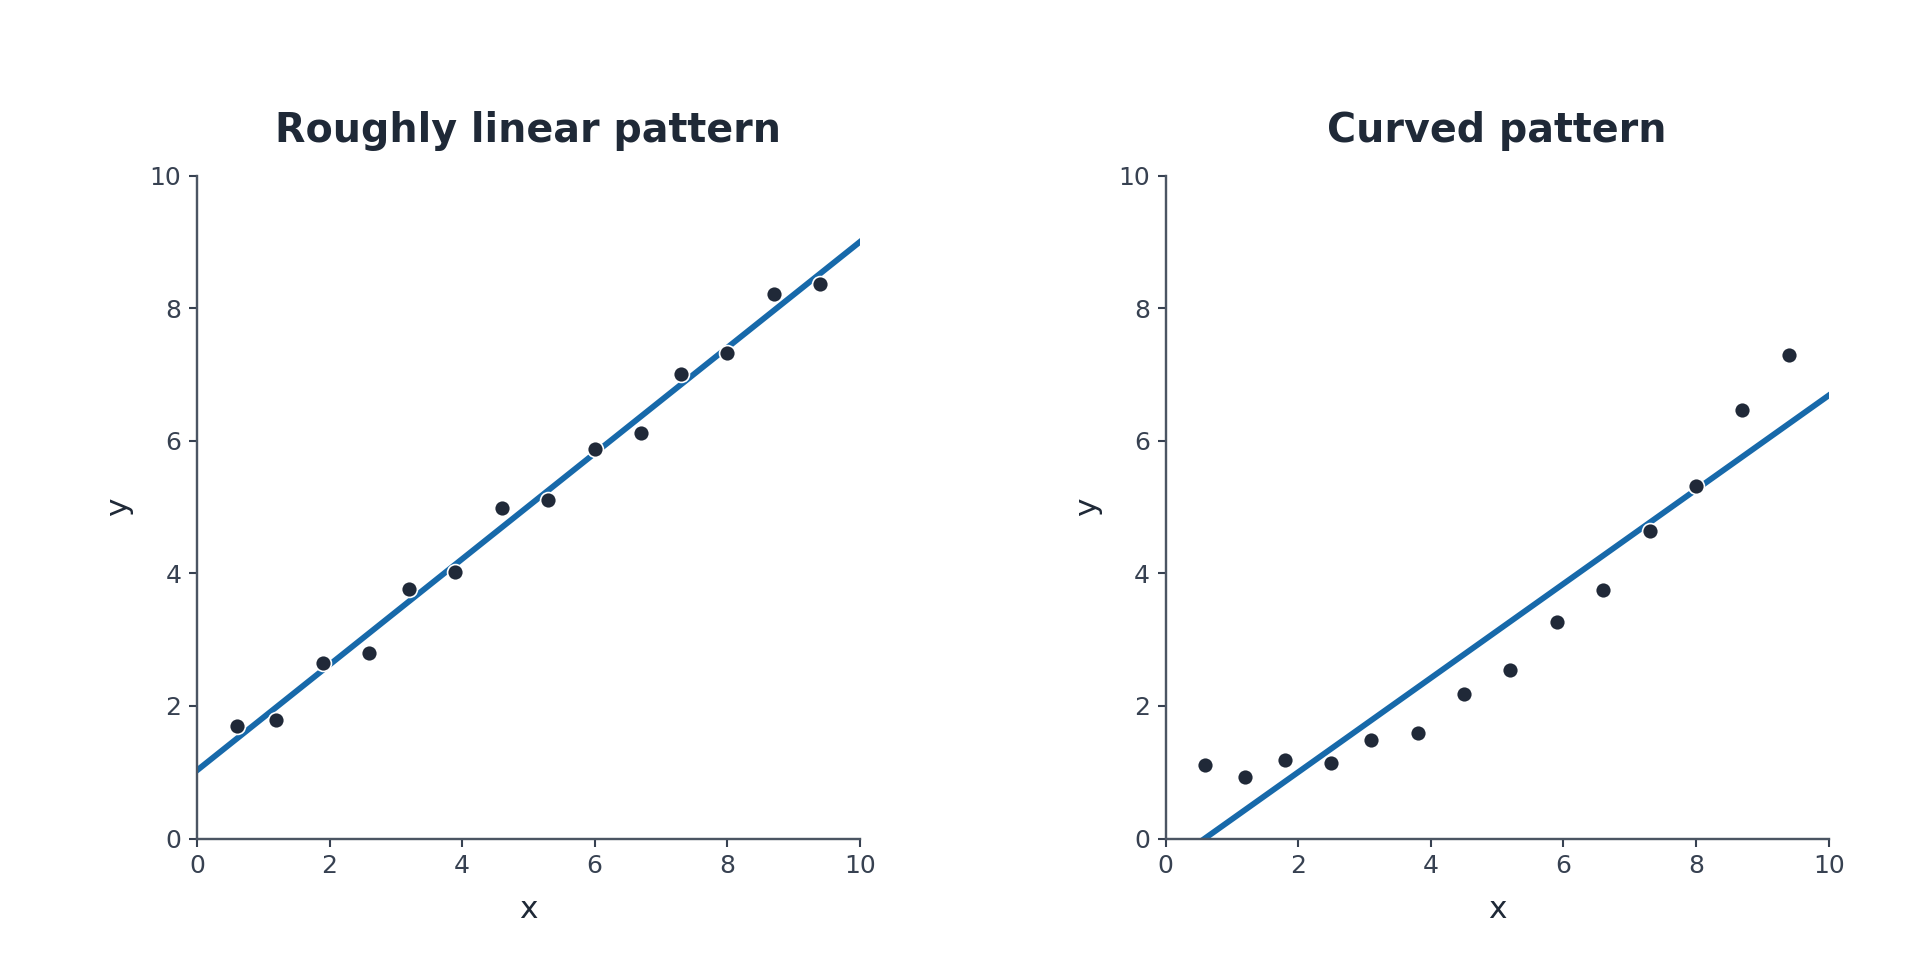
Strength alone is not enough. The relationship also needs to follow a linear pattern for a straight-line model to be appropriate. If the scatter plot reveals a curve or some other nonlinear shape, the regression line will systematically miss the true pattern — even within the observed range.
Before trusting a prediction, consider whether the original scatter plot looked roughly linear. A strong but curved relationship, for example, might produce a moderately high while still generating misleading straight-line predictions at certain values. The scatter plot on the left below shows a pattern well suited for a regression line, while the one on the right does not.