Estimating Center and Spread
Introduction
Welcome back! You are now halfway through Reading and Describing Distributions, on lesson three of five. So far, you have learned how to read the building blocks of dot plots and histograms and how to classify a distribution's overall shape. Those skills give you a strong first impression of any dataset — but a first impression leaves questions unanswered. Starting now, we get more specific and ask two new questions about every graph we see: where is the center of the data, and how spread out is it?
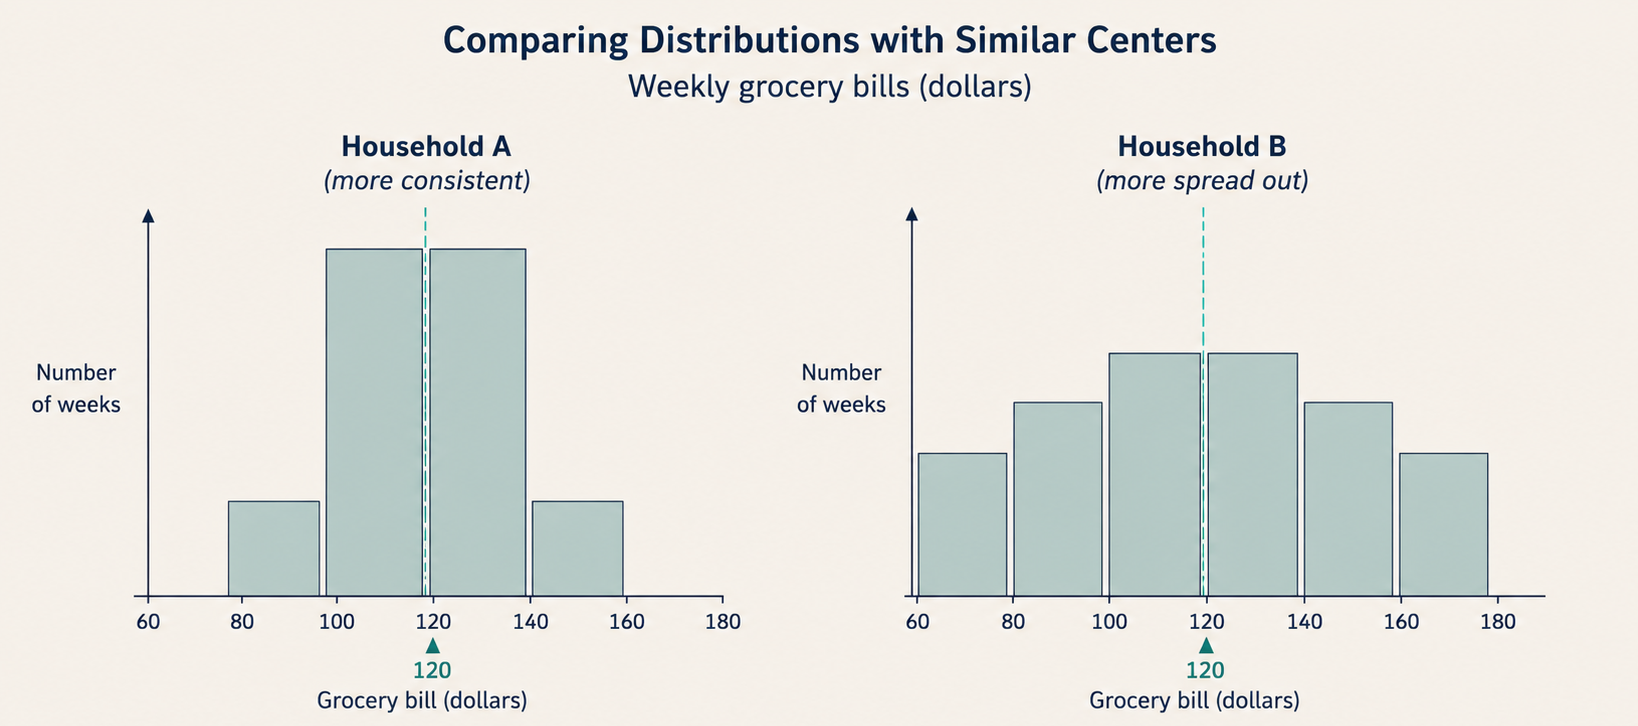
By the end of this lesson, you will be able to estimate a distribution's center by eye, judge whether values cluster tightly or loosely around that center, and compare two distributions that share a similar center but differ in variability.
From Shape to Summary
Naming a distribution's shape is a valuable first step, but shape alone does not tell the whole story. Two histograms can both be roughly symmetric yet describe very different data — one might peak around $50 and the other around $500.
That is why analysts follow up with two additional questions after identifying shape: Where does the data tend to cluster? and How much do the values spread out around that cluster? These two ideas — center and spread — round out our visual toolkit and give us a much richer picture of any distribution. In this lesson, we will practice estimating both from a graph, using nothing more than our eyes and a bit of reasoning.
Estimating Center by Eye
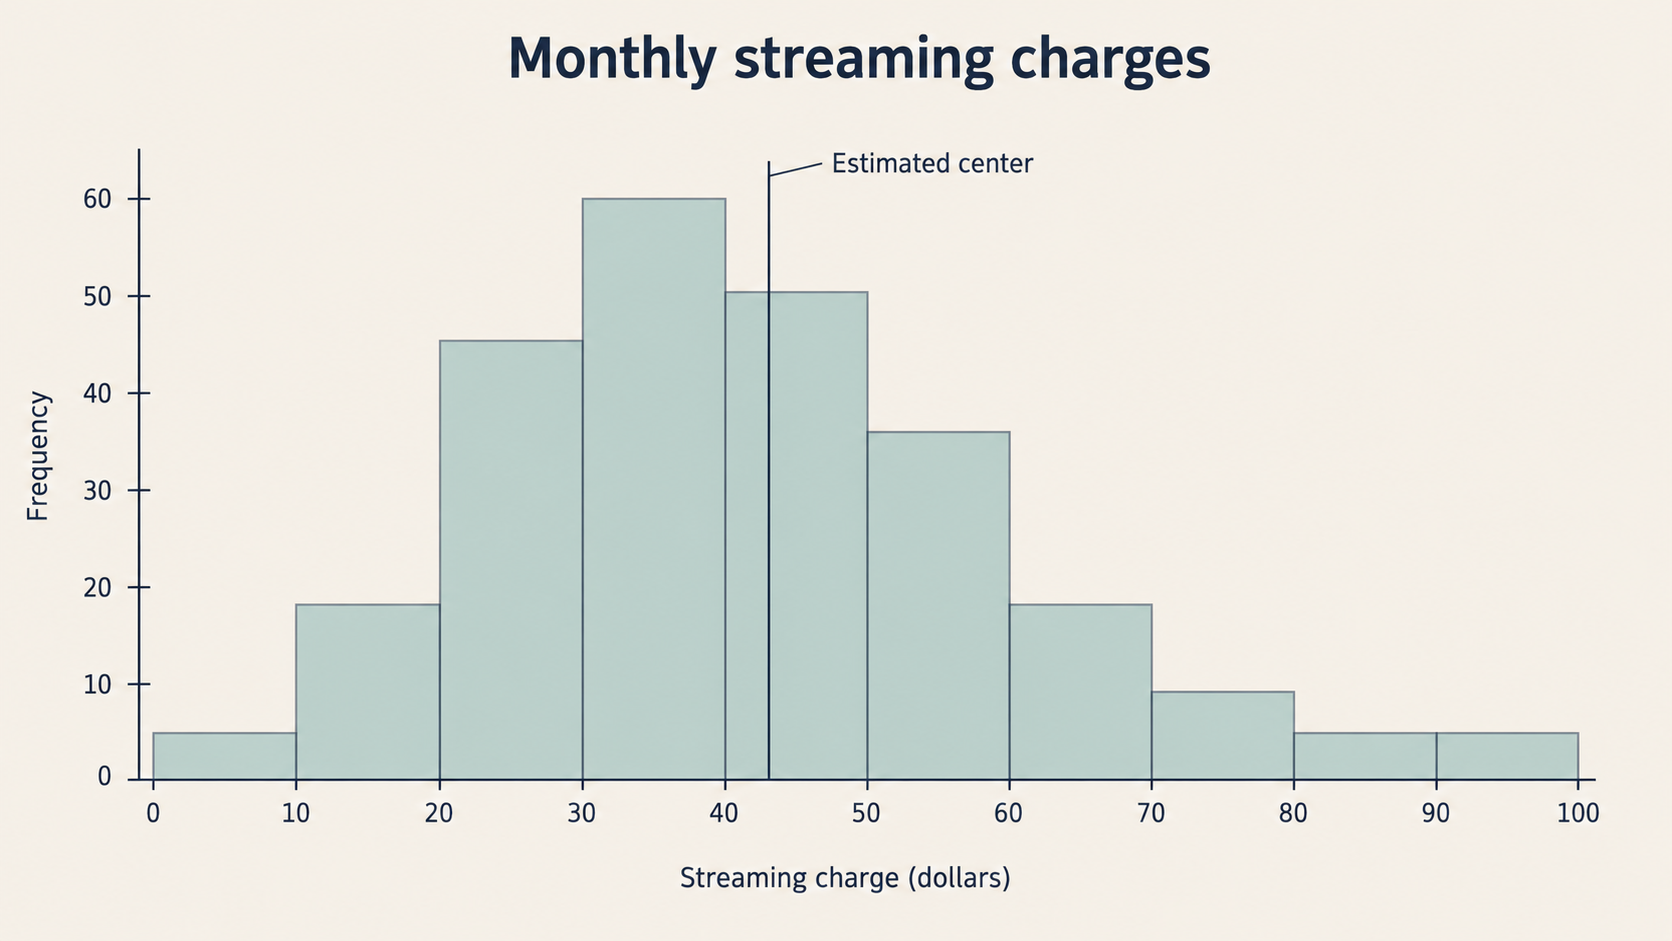
The center of a distribution is the value that best represents a "typical" observation. When you look at a dot plot or histogram, your eye is naturally drawn to the region where the most data piles up. That region is your best visual estimate of the center.
Here is a practical way to think about it. Look for the region on the horizontal axis where the data piles up most heavily — that dense cluster is your target. On a histogram, it is usually where the tallest bars sit. On a dot plot, it is the value where you could place your finger and have roughly equal amounts of data on either side. You are not looking for any single bar or dot, but rather the heart of where the data lives.
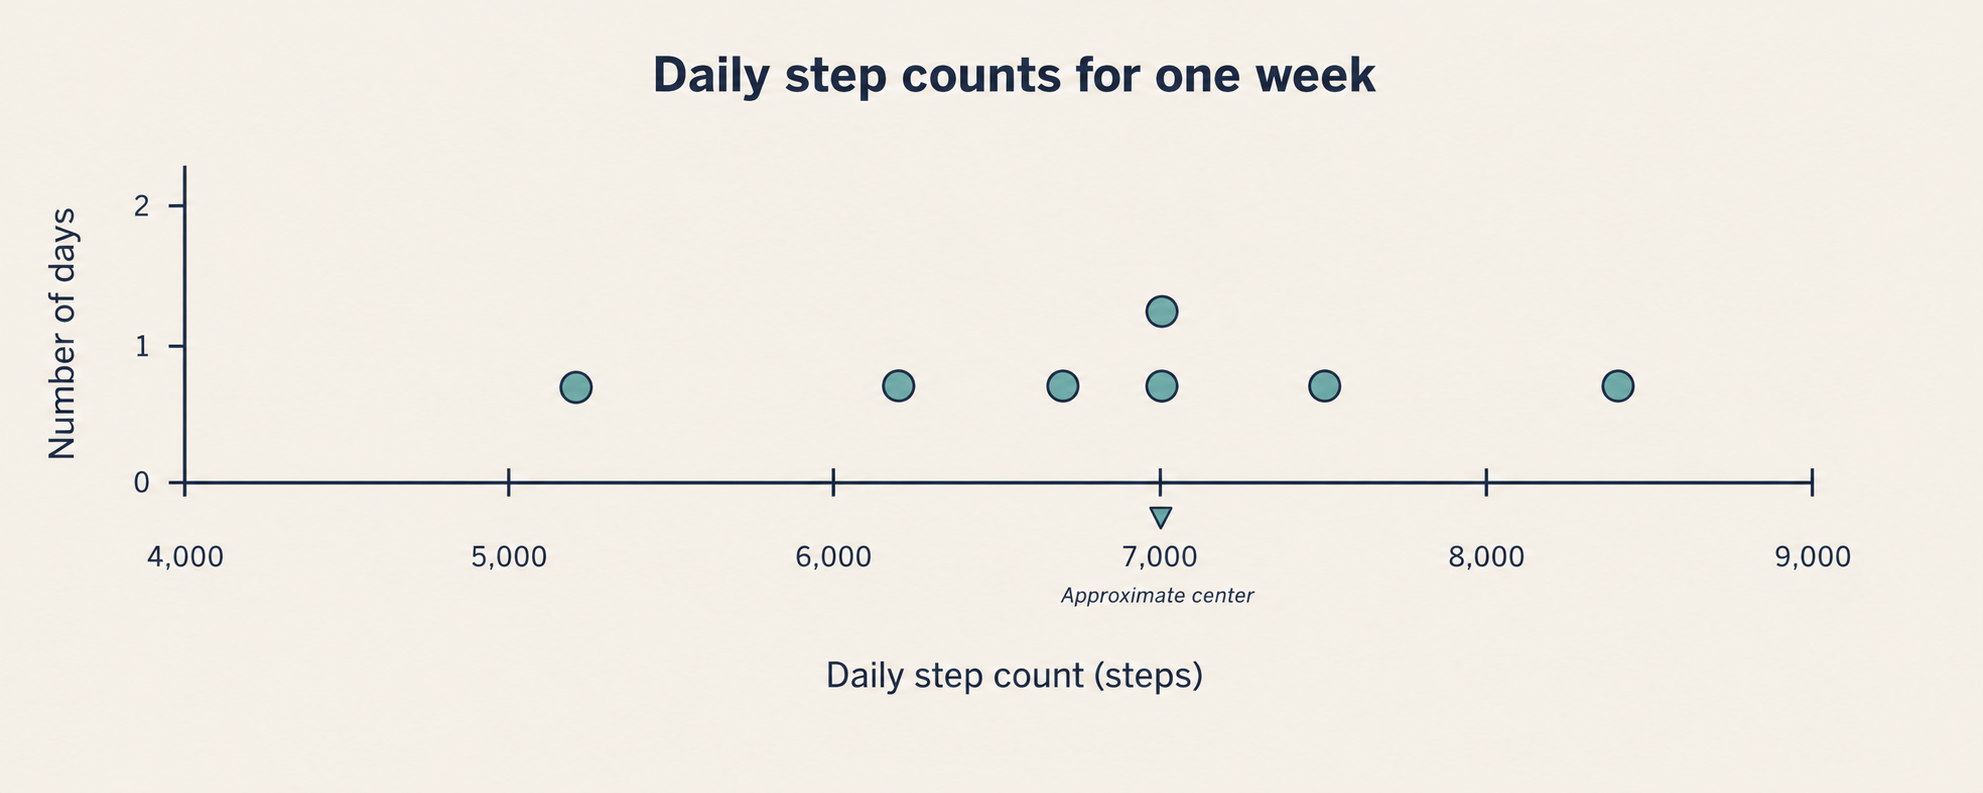
Consider the dot plot above showing daily step counts over a week. The dots cluster most heavily in one region. Rather than picking the highest single value or the lowest, we look for the middle of that dense cluster. If most dots sit between and steps, a reasonable center estimate might be around .
A few tips for estimating center visually:
- Look at where the bulk of the data sits, not where the extreme values are.
- Ignore isolated high or low values for now; they pull your attention away from the typical range.
- Be approximate. A round number near the densest region is perfectly good at this stage.