Welcome to this lesson! As the next step of solving the given problem, we will explore the data. Data exploration is crucial in any data science or machine learning project. It helps us uncover patterns, distributions, and relationships within our data, setting the stage for training the model. Our goal is to equip you with the skills to explore and visualize data effectively, making it easier to draw meaningful insights.
Visualizing numerical data is key in data exploration. It allows us to see value distributions and identify outliers or unusual patterns.
As a reminder, we can load data with the following code:
Then, we can use Matplotlib and Seaborn to create histograms and Kernel Density Estimate (KDE) plots, providing a visual representation of data distribution.
In this snippet, we use Seaborn's histplot to visualize the age column distribution. The bins parameter controls the number of bins, and kde=True adds a KDE plot for a smooth estimate. Here is the result:
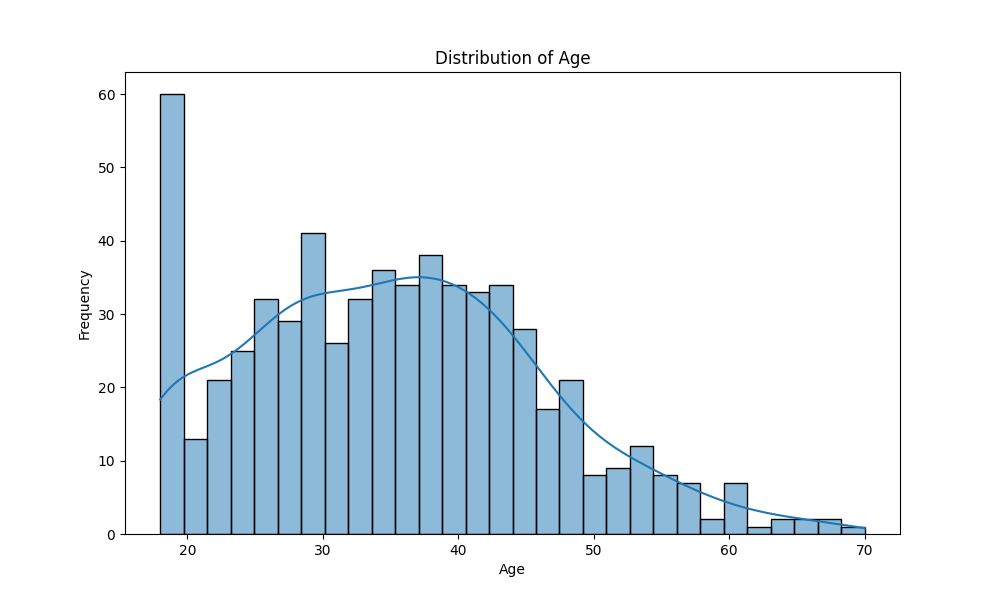
Did you spot anything strange in this plot? You might notice a large number of users with the age of 18. This anomaly occurs because users often click the "Are you 18?" button on a website, which automatically sets their age to 18. Although users can later change this, they don't always do so. We will need to address this anomaly before training the model to ensure accurate results.
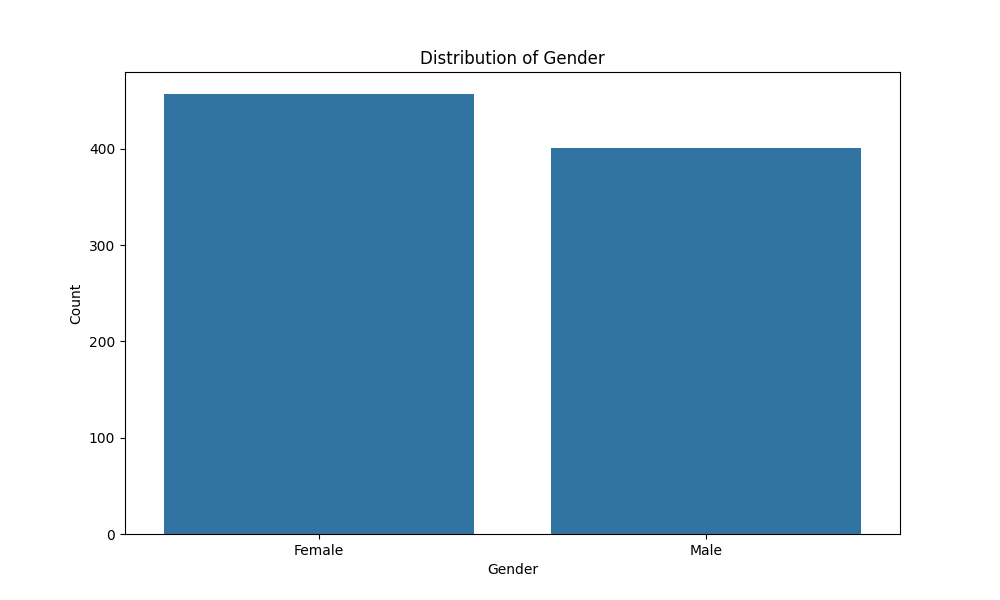
Understanding categorical data distribution is equally important. Categorical data can be visualized using bar plots, showing the frequency of each category. Seaborn's countplot is a convenient tool for this purpose, helping us quickly grasp category distribution.
Here, countplot visualizes the gender column distribution, providing a clear view of category balance or imbalance.
If some rows have missing values in the gender column, Seaborn's countplot will exclude them by default. This means the plot might not reflect the true number of records. You can check this by comparing the total number of bars in the plot to the number of non-null values in the column using df['gender'].isna().sum().
Correlation analysis helps understand relationships between numerical variables. A correlation matrix shows correlation coefficients between variable pairs, indicating their relationship strength. In machine learning, it is essential to remove features with strong correlations to other features, removing excess information from the dataset. Seaborn's heatmap visualizes this matrix, making it easier to identify significant correlations.
We select numeric columns with select_dtypes, compute the correlation matrix with corr(), and visualize it using heatmap. The annot=True parameter adds correlation coefficients, and cmap='coolwarm' sets the color scheme.
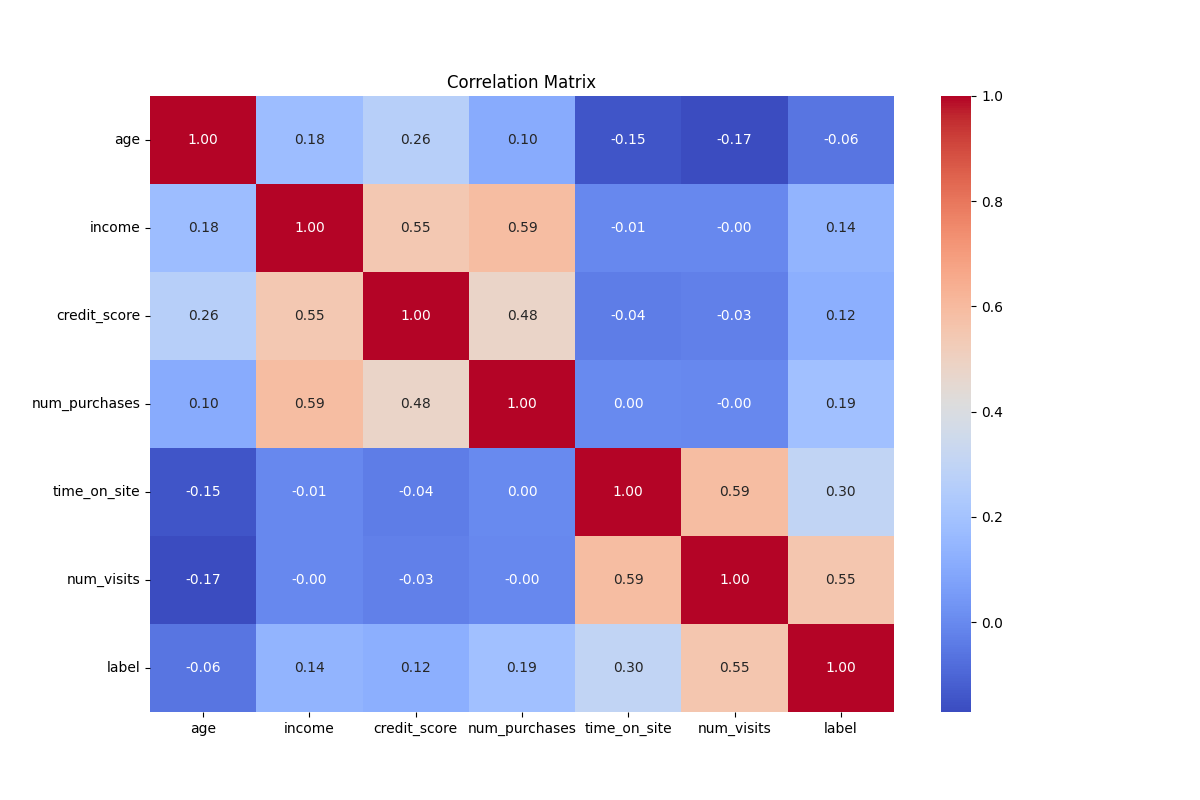
To interpret the plot, look at the correlation coefficients, which range from -1 to 1. A coefficient close to 1 indicates a strong positive correlation, meaning as one variable increases, the other tends to increase as well. A coefficient close to -1 indicates a strong negative correlation, where one variable increases as the other decreases. A coefficient around 0 suggests no linear correlation. Typically, absolute correlation values above 0.7 are considered strong, while values between 0.3 and 0.7 are moderate, and below 0.3 are weak. Identifying these relationships helps in understanding which features might be redundant and can be removed to simplify the model.
Congratulations on completing this lesson on data exploration! We've covered loading and inspecting data, visualizing numerical and categorical distributions, and analyzing correlations. These skills are foundational for any data analysis project, enabling you to uncover insights and make informed decisions based on your data.
Now that you've learned the theory, it's time to practice. In the upcoming session, you'll apply these concepts to explore our dataset. Let's get started!
