Welcome back! In the previous lesson, you built a simple linear regression model using age to predict insurance charges. Now you'll learn how to evaluate and compare multiple regression models using different features to determine which ones make the most accurate predictions.
By the end of this lesson, you will be able to build multiple regression models, compare their performance using various metrics, and decide which features are most useful for predicting insurance charges.
In the previous lesson, you only tested one feature (age) to predict insurance charges. But real-world prediction problems benefit from testing different approaches:
- Different features may be better predictors: Maybe
bmipredicts charges better thanage - Model selection: You need objective criteria to choose the best approach
- Understanding data: Comparing models reveals which factors matter most
When comparing models, you need a consistent process:
- Same data splits: Use identical train/test splits for fair comparison
- Same evaluation metrics: Calculate the same metrics for each model
- Organized storage: Keep results organized for easy comparison
- Clear decision criteria: Know how to interpret results to pick the best model
Multiple Features vs. Single Features: So far, we're comparing models that use one feature at a time (age, bmi, or children). However, you can also create models that use multiple features simultaneously, like X = insurance_data[['age', 'bmi']]. Multiple-feature models can potentially make more accurate predictions because they consider several factors together - for example, both age and BMI might jointly influence insurance charges better than either alone. However, multiple-feature models are more complex to interpret and can be prone to overfitting if you use too many features. In this lesson, we'll focus on single-feature models to build your foundation, but keep in mind that combining the best individual features often leads to even better predictions.
Let's build and compare regression models using different features: age, bmi, and children. The code below implements our systematic comparison framework:
This loop ensures each model is trained and evaluated identically, making the comparison fair and meaningful.
Residuals are the differences between actual and predicted values: residual = actual - predicted. Residual analysis helps you understand:
-
Model fit quality: Good models have residuals randomly scattered around zero
-
Pattern detection: Systematic patterns in residuals suggest your model is missing something
-
Outlier identification: Large residuals highlight unusual data points
-
Random scatter: Good! Your model captures the main relationship
-
Curved pattern: Your model might need non-linear terms
-
Funnel shape: Prediction accuracy might vary across different ranges
-
Systematic bias: Your model consistently over- or under-predicts
For each feature, create two diagnostic plots:
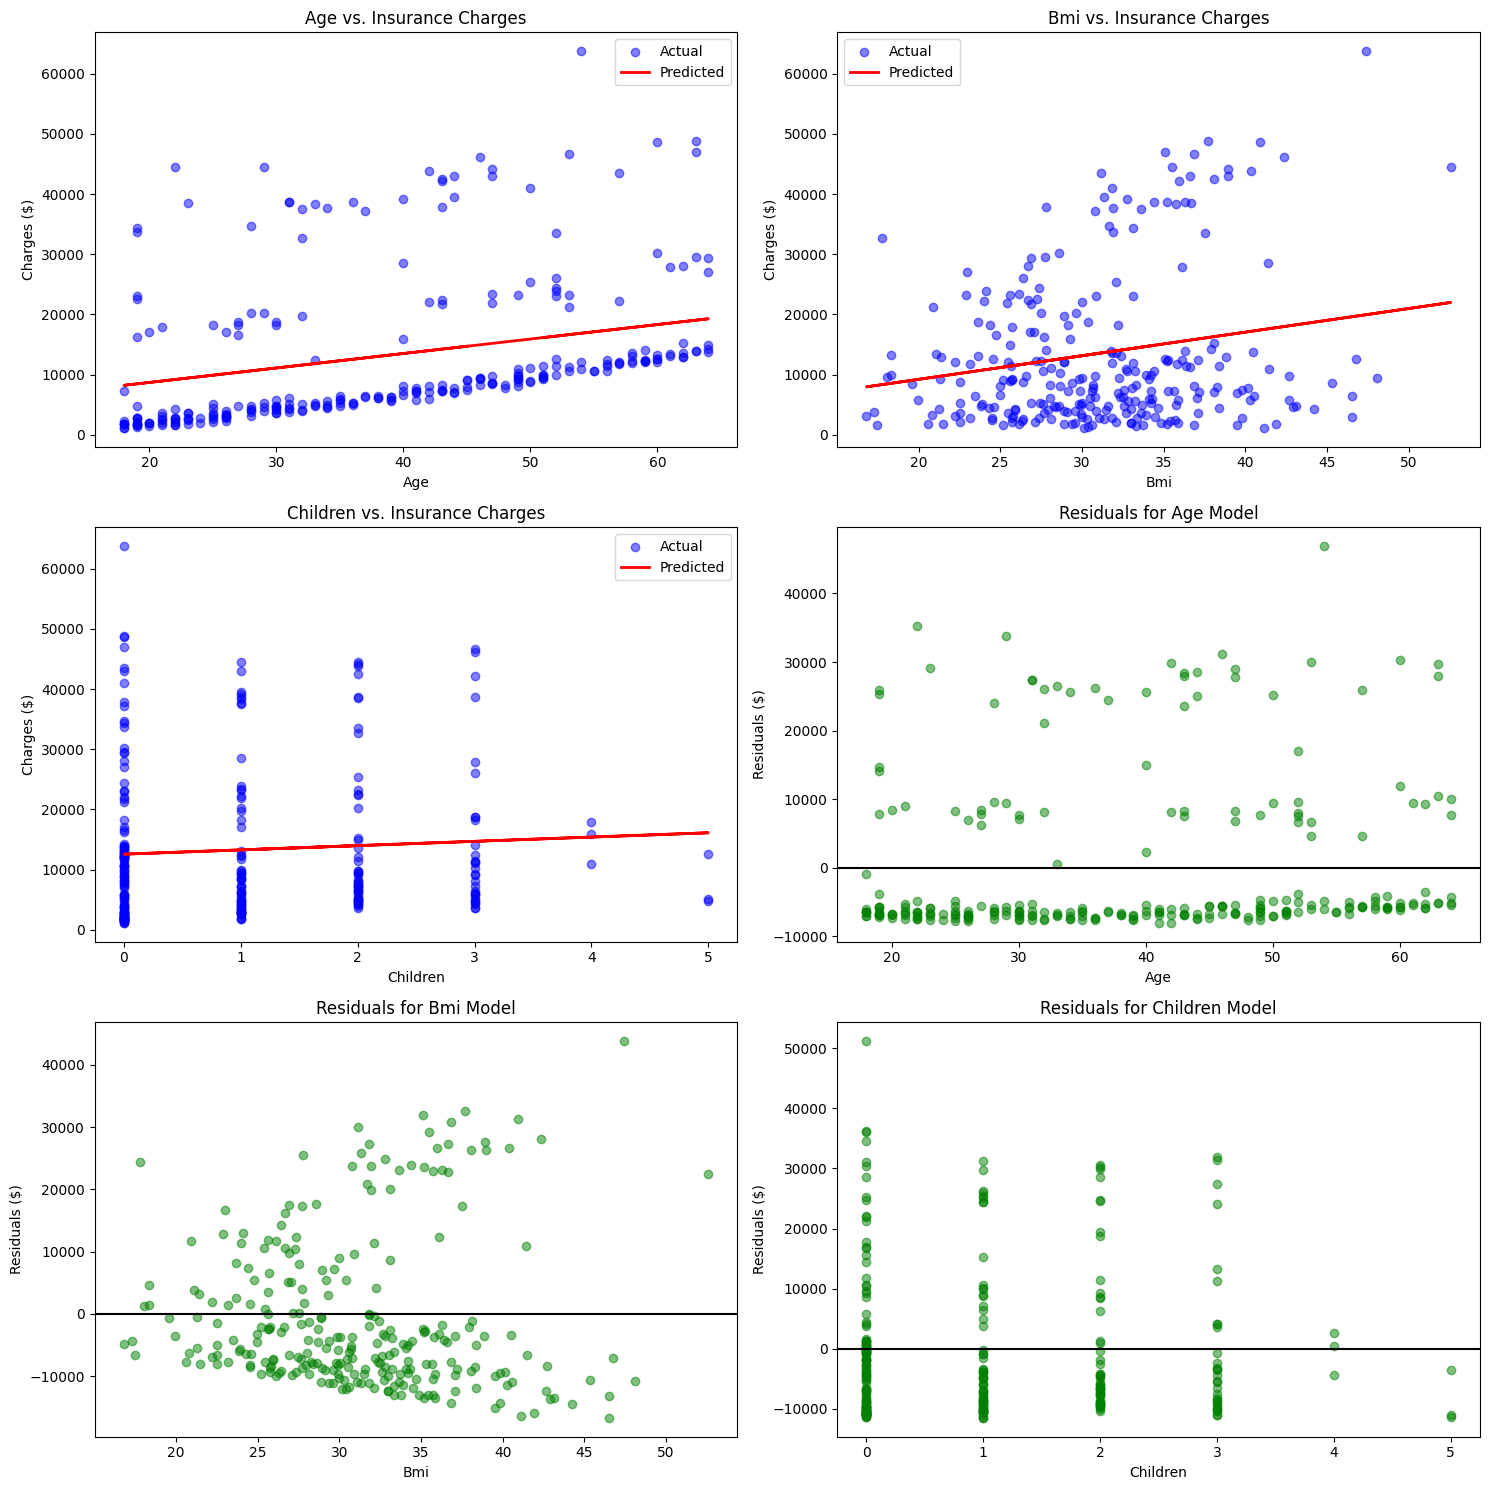
The horizontal line at zero in residual plots is your reference point. Points above the line represent over-predictions (model predicted too high), while points below represent under-predictions.
Organize your results systematically to make model selection decisions:
Sample output:
When comparing models, look for:
- Higher R-squared: More variance explained (better fit)
- Lower MSE/RMSE/MAE: Smaller prediction errors
- Consistent ranking: The best model should perform well across multiple metrics
In this example, bmi ranks best across all metrics, making it the strongest single predictor of insurance charges among the three features tested.
Consider multiple factors when choosing a model:
- Performance metrics: Primary criterion for accuracy
- Interpretability: Can stakeholders understand the relationship?
- Data availability: Will this feature be available for future predictions?
- Business context: Does the relationship make practical sense?
You learned how to evaluate and compare multiple regression models systematically. Key new concepts include:
- Mean Absolute Error (MAE) for intuitive error measurement
- Residual analysis for diagnosing model performance
- Multiple model comparison frameworks for systematic evaluation
- Model selection criteria for choosing the best approach
In the upcoming practice exercises, you'll get hands-on experience building, evaluating, and comparing regression models using different features.
