Welcome back to PredictHealth's Advanced Pricing System. In the last lesson, you learned how to fine-tune prediction models using linear regression, Ridge, and Lasso, and how to compare their performances using metrics like RMSE and R². You also practiced using regularization and hyperparameter tuning to build more accurate and interpretable models. These are essential skills for any data scientist working with health insurance pricing.
As you continue to develop more advanced models, it becomes increasingly important to ensure that your results are reliable and will generalize well to new, unseen data. In real-world insurance pricing, a model that performs well on one sample of data but poorly on another can lead to costly mistakes. This is where robust validation frameworks come in. In this lesson, you will learn how to move beyond basic validation methods and adopt more reliable techniques, such as k-fold cross-validation, to assess your models. You will also learn how to integrate preprocessing and modeling into a single pipeline, visualize validation results, and generate predictions with confidence intervals. By the end of this lesson, you will be able to build and validate models that are not only accurate but also trustworthy for production use.
Before we dive into robust validation methods, let's quickly revisit the basic approach you have used so far: the train-test split. In previous lessons, you split your data into a training set and a testing set. You trained your model on the training set and evaluated its performance on the testing set. This approach is simple and gives you a quick estimate of how your model might perform on new data.
However, the train-test split has some limitations. The results you get depend heavily on how the data is split. If the split is not representative, your model's performance metrics might be misleading. For example, if the test set happens to contain mostly high-cost customers, your RMSE and R² scores could look worse than they really are. In real-world insurance pricing, you need more reliable estimates of model performance, especially when your decisions affect pricing and risk.
To address these limitations, we need more robust validation techniques that use all available data more effectively and provide a better sense of how the model will perform in production.
One of the most widely used robust validation techniques is k-fold cross-validation. Instead of splitting the data just once, k-fold cross-validation divides the data into k equal parts, or "folds." The model is trained on k-1 folds and tested on the remaining fold. This process is repeated k times, with each fold used as the test set once. The results are then averaged to give a more reliable estimate of model performance.
In Python, scikit-learn makes it easy to implement k-fold cross-validation using tools like KFold, cross_val_score, and cross_val_predict. For example, in the code below, we set up 5-fold cross-validation and evaluate three different models: Linear Regression, Ridge, and Lasso. We use cross_val_score to calculate the RMSE and R² scores for each fold.
A sample output might look like this:
By using k-fold cross-validation, you get a more stable and trustworthy estimate of your model's performance, which is crucial for making decisions in insurance pricing.
As your models become more complex, it is important to keep your workflow organized and reproducible. In previous lessons, you learned to preprocess your data and fit models in separate steps. However, when using cross-validation, you want to make sure that all preprocessing (like scaling and encoding) happens inside each fold, not before. Otherwise, information from the test folds could leak into the training process, leading to overly optimistic results.
scikit-learn's Pipeline and ColumnTransformer tools help you build robust workflows that combine preprocessing and modeling into a single, unified process. In the example below, we define a pipeline that standardizes numerical features, one-hot encodes categorical features, and then fits a regression model — all in one step.
By using pipelines, you ensure that all data transformations are applied correctly within each fold of cross-validation. This leads to more reliable validation results and makes your code easier to maintain and reuse.
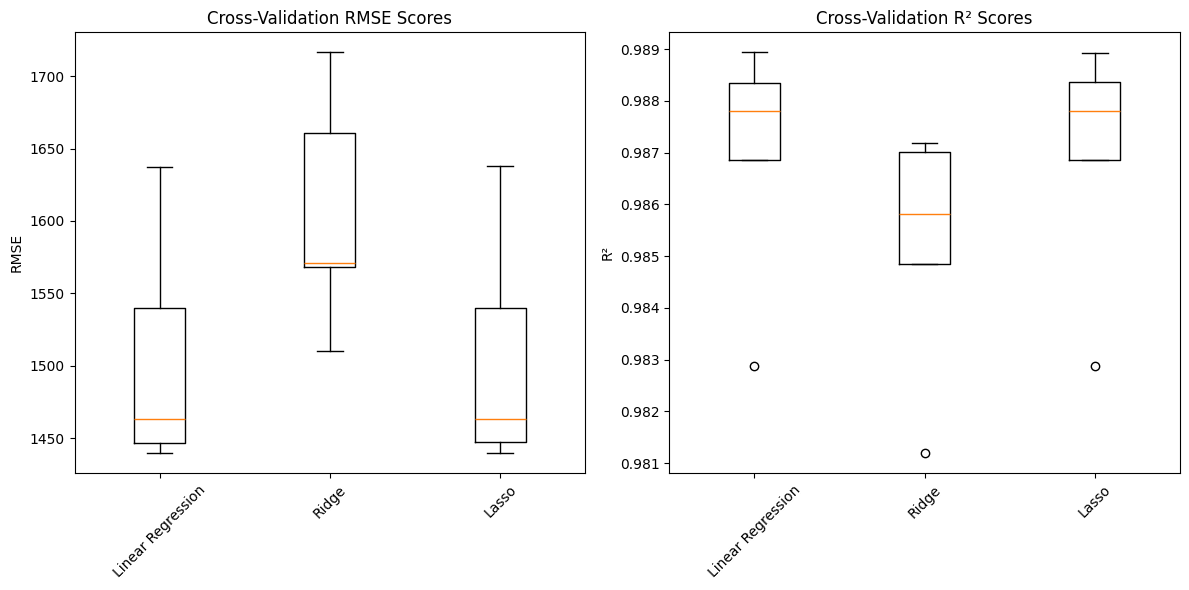
Numbers alone do not always tell the full story. Visualizing your validation results can help you understand how consistent your model's performance is across different folds. For example, you can use box plots to display the distribution of RMSE and R² scores for each model.
In the code below, we collect the RMSE and R² scores from cross-validation and plot them using matplotlib:
These plots help you quickly see which models are more stable and which ones have more variation in their performance. For example, a model with a narrow box (less spread) in the RMSE plot is more consistent across different data splits, which is desirable in production settings.
In this lesson, you learned why robust validation is essential for building reliable health insurance pricing models. You revisited the limitations of the train-test split and saw how k-fold cross-validation provides a more trustworthy estimate of model performance. You also learned how to build robust pipelines that combine preprocessing and modeling, visualize validation results for deeper insights, and generate predictions with confidence intervals to communicate uncertainty.
These skills are crucial for deploying models in real-world insurance settings, where accuracy and reliability directly impact business outcomes. In the next section, you will have the opportunity to practice these techniques yourself. You will use cross-validation, build pipelines, visualize results, and generate predictions with confidence intervals. Keep up the great work — your ability to build and validate robust models is a key asset in the world of advanced insurance analytics!
