Establishing KPIs and Tracking
Welcome to the Course
Every campaign you run generates more data than anyone can read, and most of it is noise dressed up as insight. This course is about the discipline that separates a sharp Digital Marketing Manager from a dashboard-reader: knowing which numbers actually reflect performance, and being able to defend that judgment when a skeptical stakeholder pushes back.
By the end of this course, you'll be able to:
- Distinguish decision-driving KPIs from vanity metrics across every objective
- Calculate ROI and ROAS and interpret how attribution models shift the credit
- Design clean A/B tests and apply the right optimization levers to scale what works
- Diagnose why platform-reported numbers rarely match internal business systems
- Turn campaign results into a data story that stakeholders will act on
This first unit starts at the foundation: choosing the right KPIs, and understanding how the tracking behind them actually captures data.
Choosing KPIs That Drive Decisions
Here's a question worth sitting with: if your ad set delivered two million impressions last week, so what? Impressions feel like progress, but they don't tell you whether to raise a bid, kill a creative, or move budget. A metric earns the title KPI only when a change in it would change a decision you make. Everything else is a vanity metric: flattering, easy to screenshot, and useless for action.
The trap is that vanity metrics aren't fake. They're real numbers pointed at the wrong question. The fix is to anchor each metric to what you're actually trying to achieve, which is what the KPI Objective Map does: reach ties to awareness, engagement to consideration, conversion to action, and return to the business outcome. Read a metric, ask which of those four it serves, then ask whether it would actually move a decision.
- Milo: The client's thrilled, our reel just hit 400,000 views this week.
- Nova: Views against what goal? This was the free-trial push, right?
- Milo: Right, conversion. Signups are... flat, actually.
- Nova: Then the view count is the vanity metric. Cost per signup is the number that tells us whether to keep spending.
- Milo: So I lead the report with signups and treat views as context, not the headline.
Notice that the objective, not the size of the number, decides which metric leads.
Following the Data From Click to Report
Before you can trust a KPI, you should be able to answer a harder question: where did that number even come from? Most managers treat the dashboard as a black box, which is exactly why they can't defend it when finance starts probing. The Tracking Data Flow demystifies it in four steps: an ad interaction happens (a click, a view), a tracking signal captures it (a pixel firing on your site, a cookie, or the platform's own analytics), an attribution model decides which touchpoint gets credit, and the campaign report displays the result.
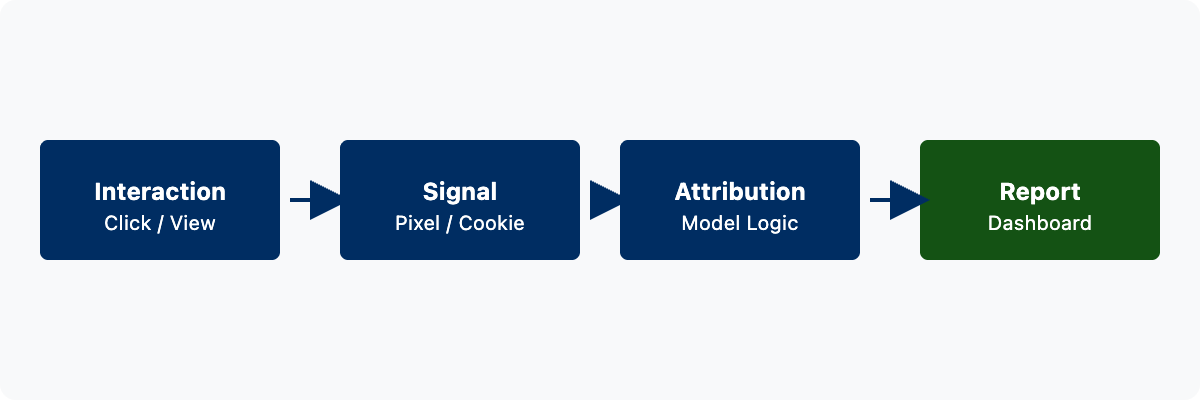
Each handoff is a place where reality can leak out. A pixel that didn't fire, a cookie the browser blocked, an opt-out under Apple's App Tracking Transparency: any of these means the interaction happened but the signal never reached the report. Understanding this chain is what lets you say, with confidence, both what a number means and where it might be soft.
Diagnosing Tracking Discrepancies
So when your platform reports 500 conversions and the internal sales system shows 400, which one is lying? Neither, usually. They're measuring different things. The platform counts conversions within its own attribution window and often credits view-through actions; your sales system counts closed revenue on its own timeline. Cross-device journeys, deduplication rules, ATT opt-outs, and cookie loss all widen the gap. A user who clicks on mobile and buys on desktop can vanish from one system and surface in the other.
The point isn't to force the two numbers to match, because they rarely will. It's to know which figure to trust for which decision: platform data for optimizing in-flight campaigns, internal data for reporting real revenue. When you can name the cause of a gap, a mismatch stops being a red flag and becomes an expected, explainable feature of measurement.
The through-line of this unit is simple to state and hard to practice: a number only matters if it changes a decision, and you can only trust it if you know how it was captured. Next, you'll put that lens to work in a quick self-check, spotting the vanity metric hiding in a sample report and naming the KPI that should have led instead. As you go, keep asking the uncomfortable question: which of these numbers would actually change what I do tomorrow?
