Welcome back to Percentages in News and Statistics! In the first lesson of this course, you learned how to calculate percent increase and decrease using the change-over-original method. That skill helps you measure how much something shifted. In this second lesson, we turn to a different, equally important question: who or what does a percentage describe?
Every day, news outlets and research organizations publish statements like "54% of Americans are concerned about healthcare costs" or "68% of young voters disapprove of the president's job performance." These numbers only make sense when we know exactly which group the percentage refers to. Here, we will learn to read percentages as shares of a clearly defined group and practice identifying the whole behind each claim.
In the previous lesson, our percentages answered the question "by how much did this value go up or down?" The base was always the original value in a before-and-after pair. Starting now, we shift to a different type of percentage — one that answers a snapshot question: "what fraction of a group has a certain characteristic right now?"
Think of a pie chart in a news article. Each slice represents a share of the whole pie, and the whole pie represents a specific group of people or items. Before you can make sense of any slice, you need to know what the pie stands for. That is the core idea of this lesson: name the group first, then interpret the percent.
As you may recall from earlier courses, every percent calculation involves three pieces: the part, the whole, and the rate (the percent itself). When we read a survey result, the rate is printed right there in the headline. The part is whatever sub-count the survey is highlighting. But the whole — the base group — is sometimes stated clearly and sometimes buried or even missing.
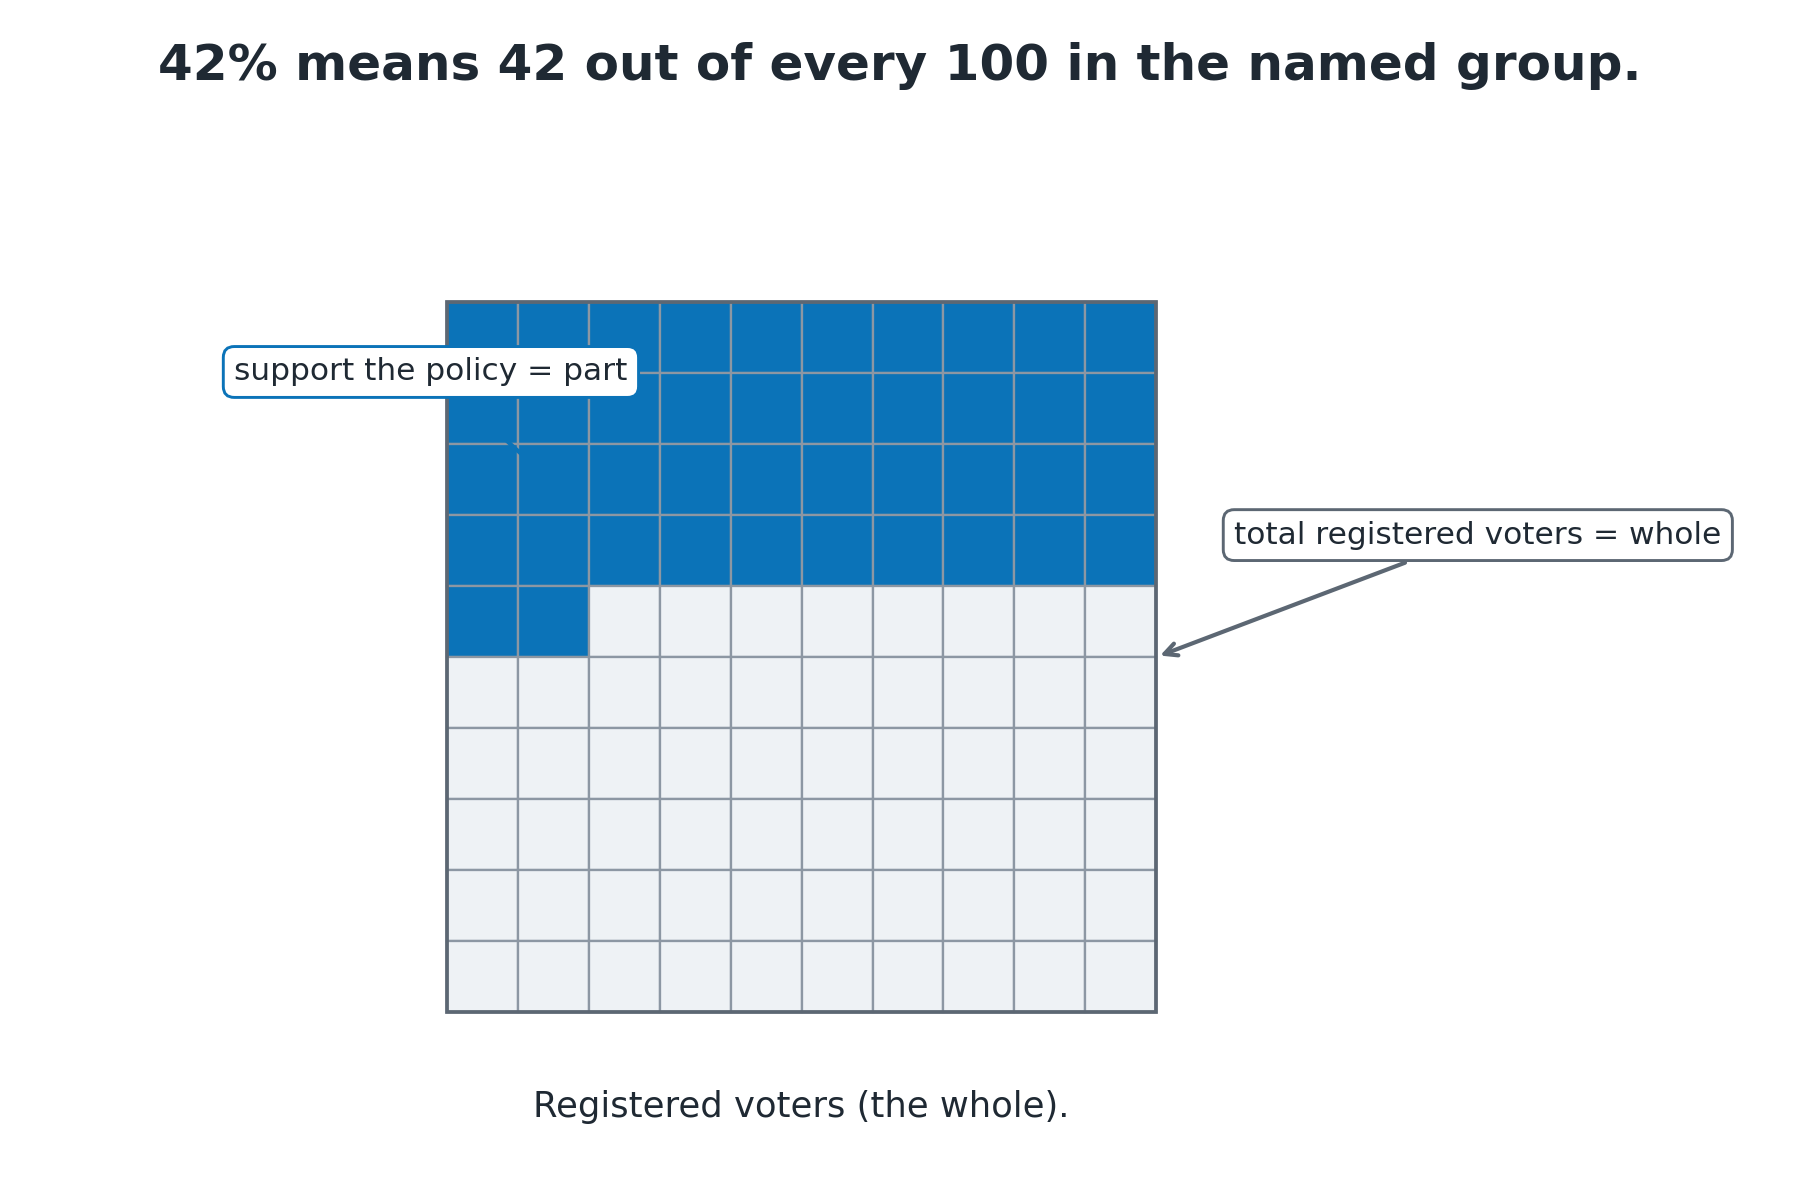
Consider this statement:
"42% of registered voters support the proposed policy."
Here the math behind the scenes looks like this:
Most well-written survey reports name the base group right after the percentage. Here is a simple pattern to look for:
[Percent] of [Group] [verb] [something].
For example: "54% of Americans are concerned about healthcare costs," "68% of voters aged 18 to 29 disapprove of the president's performance," and "88% of respondents reported feeling some form of financial stress." In each sentence, the words right after "of" tell you the whole. Let's organize these into a quick reference table:
Notice how each group is different in size and composition. Swapping one group for another would change the meaning of the percentage entirely.
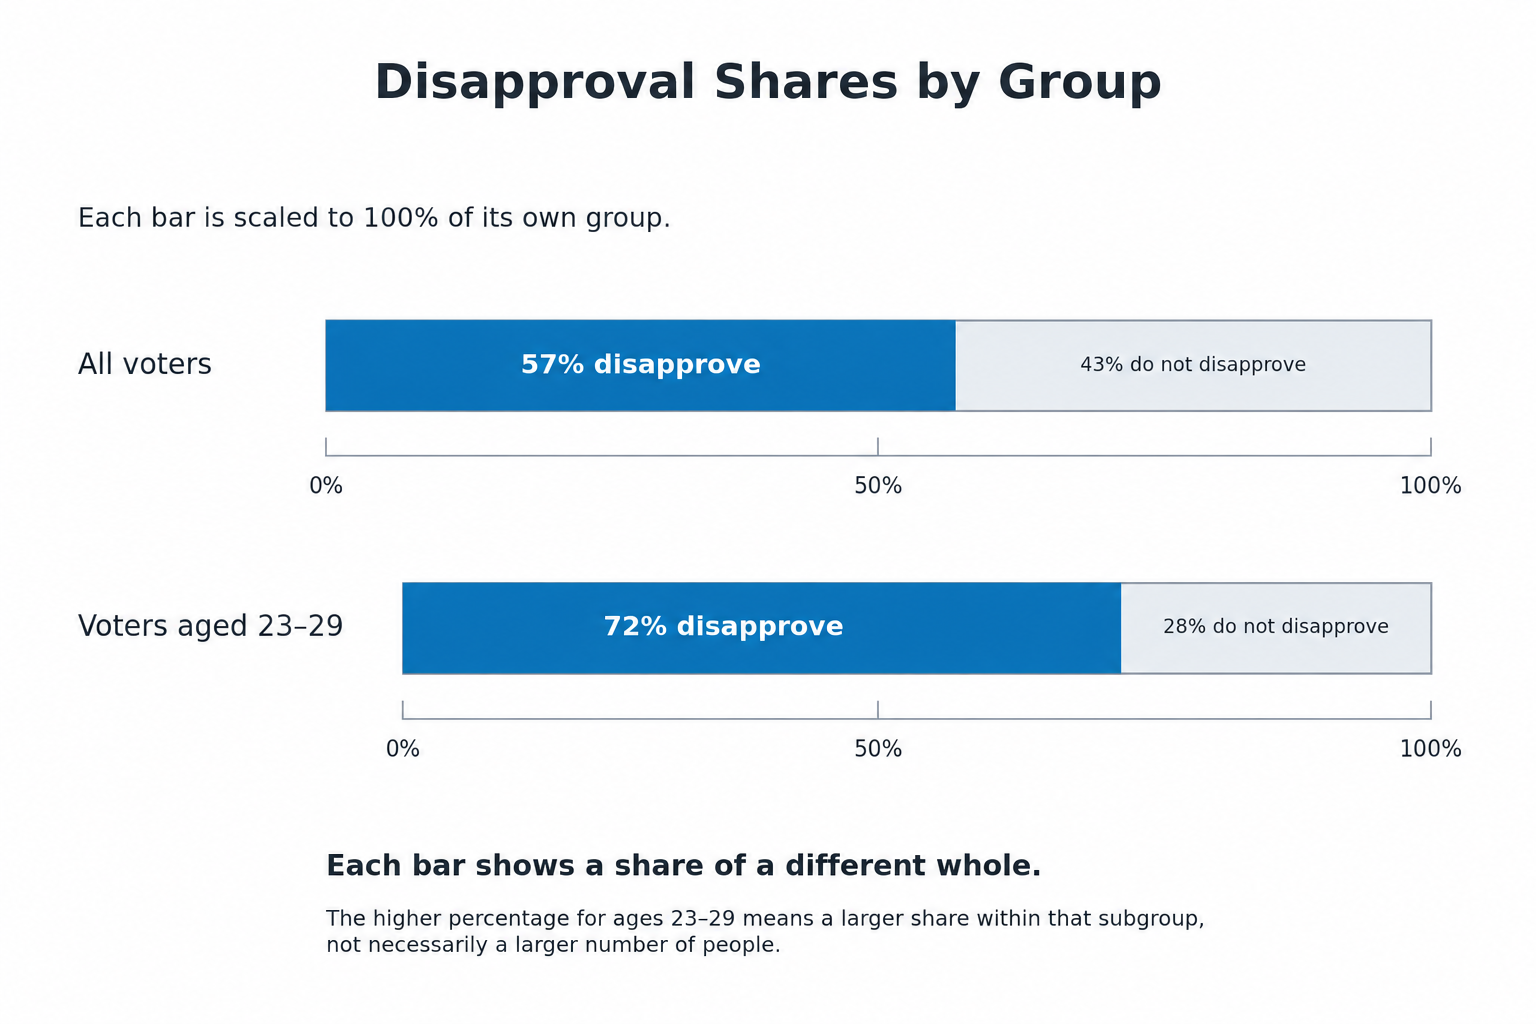
One of the trickiest situations in news and statistics is when two percentages discuss the same topic but use different base groups. Suppose a news site reports two findings from the same survey:
- "57% of all voters disapprove of the president's job performance."
- "72% of voters aged 23 to 29 disapprove of the president's job performance."
Both percentages measure disapproval, but each one divides by a different whole:
For the first figure, "the group" is every voter surveyed. For the second, it is only voters aged 23 to 29. The higher percentage for the younger subgroup does not mean more young people disapprove in raw count — it means a larger share of that smaller group disapproves. Keeping the groups straight prevents us from drawing the wrong conclusion.
Whenever you encounter a percentage in a headline, poll summary, or chart, use this three-step check:
- Find the percent. Locate the number and the percent sign.
- Name the whole. Ask, "Percent of whom or what?" Look for the phrase right after "of."
- State the claim in plain language. Rewrite the finding as: "Out of every 100 [group members], about [percent] of them [do/think/are something]."
Let's apply these steps to a real-style report: "39% of Americans believe their personal finances will stay about the same next year." The percent is 39%. The whole is Americans. In plain language: out of every 100 Americans, about 39 expect their finances to remain roughly unchanged. This habit of restating the claim forces you to confirm the base group before you react to the number.
Not every statement makes the whole obvious. Sometimes you will see claims like "Support jumped to 61%" or "Only 19% have never used AI." These sentences are missing the phrase "of [Group]." Without that information, we cannot tell if the percentage applies to all adults, to a specific age range, to one political party, or to survey respondents only.
A responsible reader pauses and asks: "61% of whom?" or "19% of which people?" Later in this course, we will spend an entire lesson on spotting these missing bases and understanding why they matter. For now, simply building the reflex to ask the question is a powerful first step.
In this lesson, you learned that every percentage in a news report or survey is a share of a specific group, and identifying that group is essential before drawing any conclusion. The key habit is to always ask, "Percent of whom?" and look for the base group stated or implied in the sentence. We also saw that the same topic can produce very different percentages when the base group changes, so mixing up groups leads to misinterpretation.
Now it is time to put this skill into action! In the upcoming practice tasks, you will identify base groups in real-style poll statements, match percentages to their correct wholes, and write your own plain-language interpretations. Let's see how sharp your group-spotting instincts have become!