If you've worked with Grafana dashboards before, you've probably experienced this scenario: you set up beautiful visualizations showing CPU usage, memory consumption, and disk space across your servers. Everything looks great during the day when you're actively monitoring. But what happens at 3 AM when CPU usage suddenly spikes to 95% and stays there? Your dashboard faithfully displays the problem, but nobody is watching. By the time you arrive at work the next morning, your application has been running slowly for hours, frustrated users have already opened support tickets, and you're scrambling to understand what went wrong.
This is the fundamental limitation of passive monitoring. Dashboards are excellent tools for understanding system behavior and investigating problems, but they require constant human attention. You can't stare at graphs 24 hours a day, and hiring someone to do nothing but watch dashboards would be both expensive and impractical. What you need is a way for Grafana to actively watch for problems and notify you the moment something goes wrong.
Alert rules transform Grafana from a passive observation tool into a proactive monitoring system. Instead of waiting for you to notice a problem, Grafana continuously evaluates conditions you define and automatically notifies the right people when those conditions are met. An alert rule might check every minute whether CPU usage has stayed above 80% for five consecutive minutes, and if so, send a notification to your team's Slack channel or trigger a page to the on-call engineer.
By the end of this lesson, you'll create your first alert rule that monitors CPU usage across your infrastructure. Specifically, you'll build an alert that fires when any server's CPU exceeds 80% for ten minutes. This rule will demonstrate the core concepts that apply to all Grafana alerts: writing queries that return the right data structure, configuring conditions that determine when to alert, setting evaluation intervals that balance responsiveness with stability, and understanding how alert states transition from normal to pending to firing. These fundamentals will serve as the foundation for more sophisticated multi-condition alerts and intelligent notification routing that you'll learn in later units.
Before creating an alert rule, you need to understand the data you're monitoring. In this lesson, you'll work with a PostgreSQL table called metrics_cpu that records CPU usage measurements from various servers in your infrastructure. This table follows a simple but effective structure for time series data.
The ts column contains the timestamp when each measurement was taken. This is a timestamp with time zone (timestamptz), ensuring that measurements are correctly ordered regardless of where your servers are located geographically. The host column identifies which server the measurement came from, using text values like "host-a" or "host-b." The usage column stores the CPU usage percentage as a numeric value, typically ranging from 0 to 100.
Your monitoring system inserts new rows into this table every minute for each server being tracked. If you were to query the most recent data, you might see results like this:
Each row represents a snapshot of one server's CPU usage at a specific moment. The first host is running at a moderate load, the second is approaching the threshold, and the third is experiencing high CPU usage. New measurements arrive every minute, creating a continuous stream of data that tracks how CPU usage evolves over time.
The 80% threshold you'll use in your alert rule is a common industry standard based on practical experience. When CPU usage consistently stays above 80%, performance begins to degrade noticeably. Response times increase, requests start queuing up, and users experience sluggish behavior. While brief spikes to 85% or 90% during normal operations are usually fine — perhaps during a batch job or a sudden traffic burst — sustained high CPU usage indicates a problem that needs attention. You might be running out of capacity and need to scale up, or there might be a runaway process consuming resources. Either way, 80% provides enough headroom to catch problems before they become critical, while avoiding false alarms from normal load variations.
Now you're ready to create your first alert rule. Alert rules live in a dedicated section of Grafana's interface, separate from dashboards. This separation makes sense because alerts serve a different purpose than visualizations — they're about detection and notification rather than display. To begin, click on the Alerting icon in the left sidebar of Grafana. This icon looks like a bell and appears below the dashboard and explore icons.
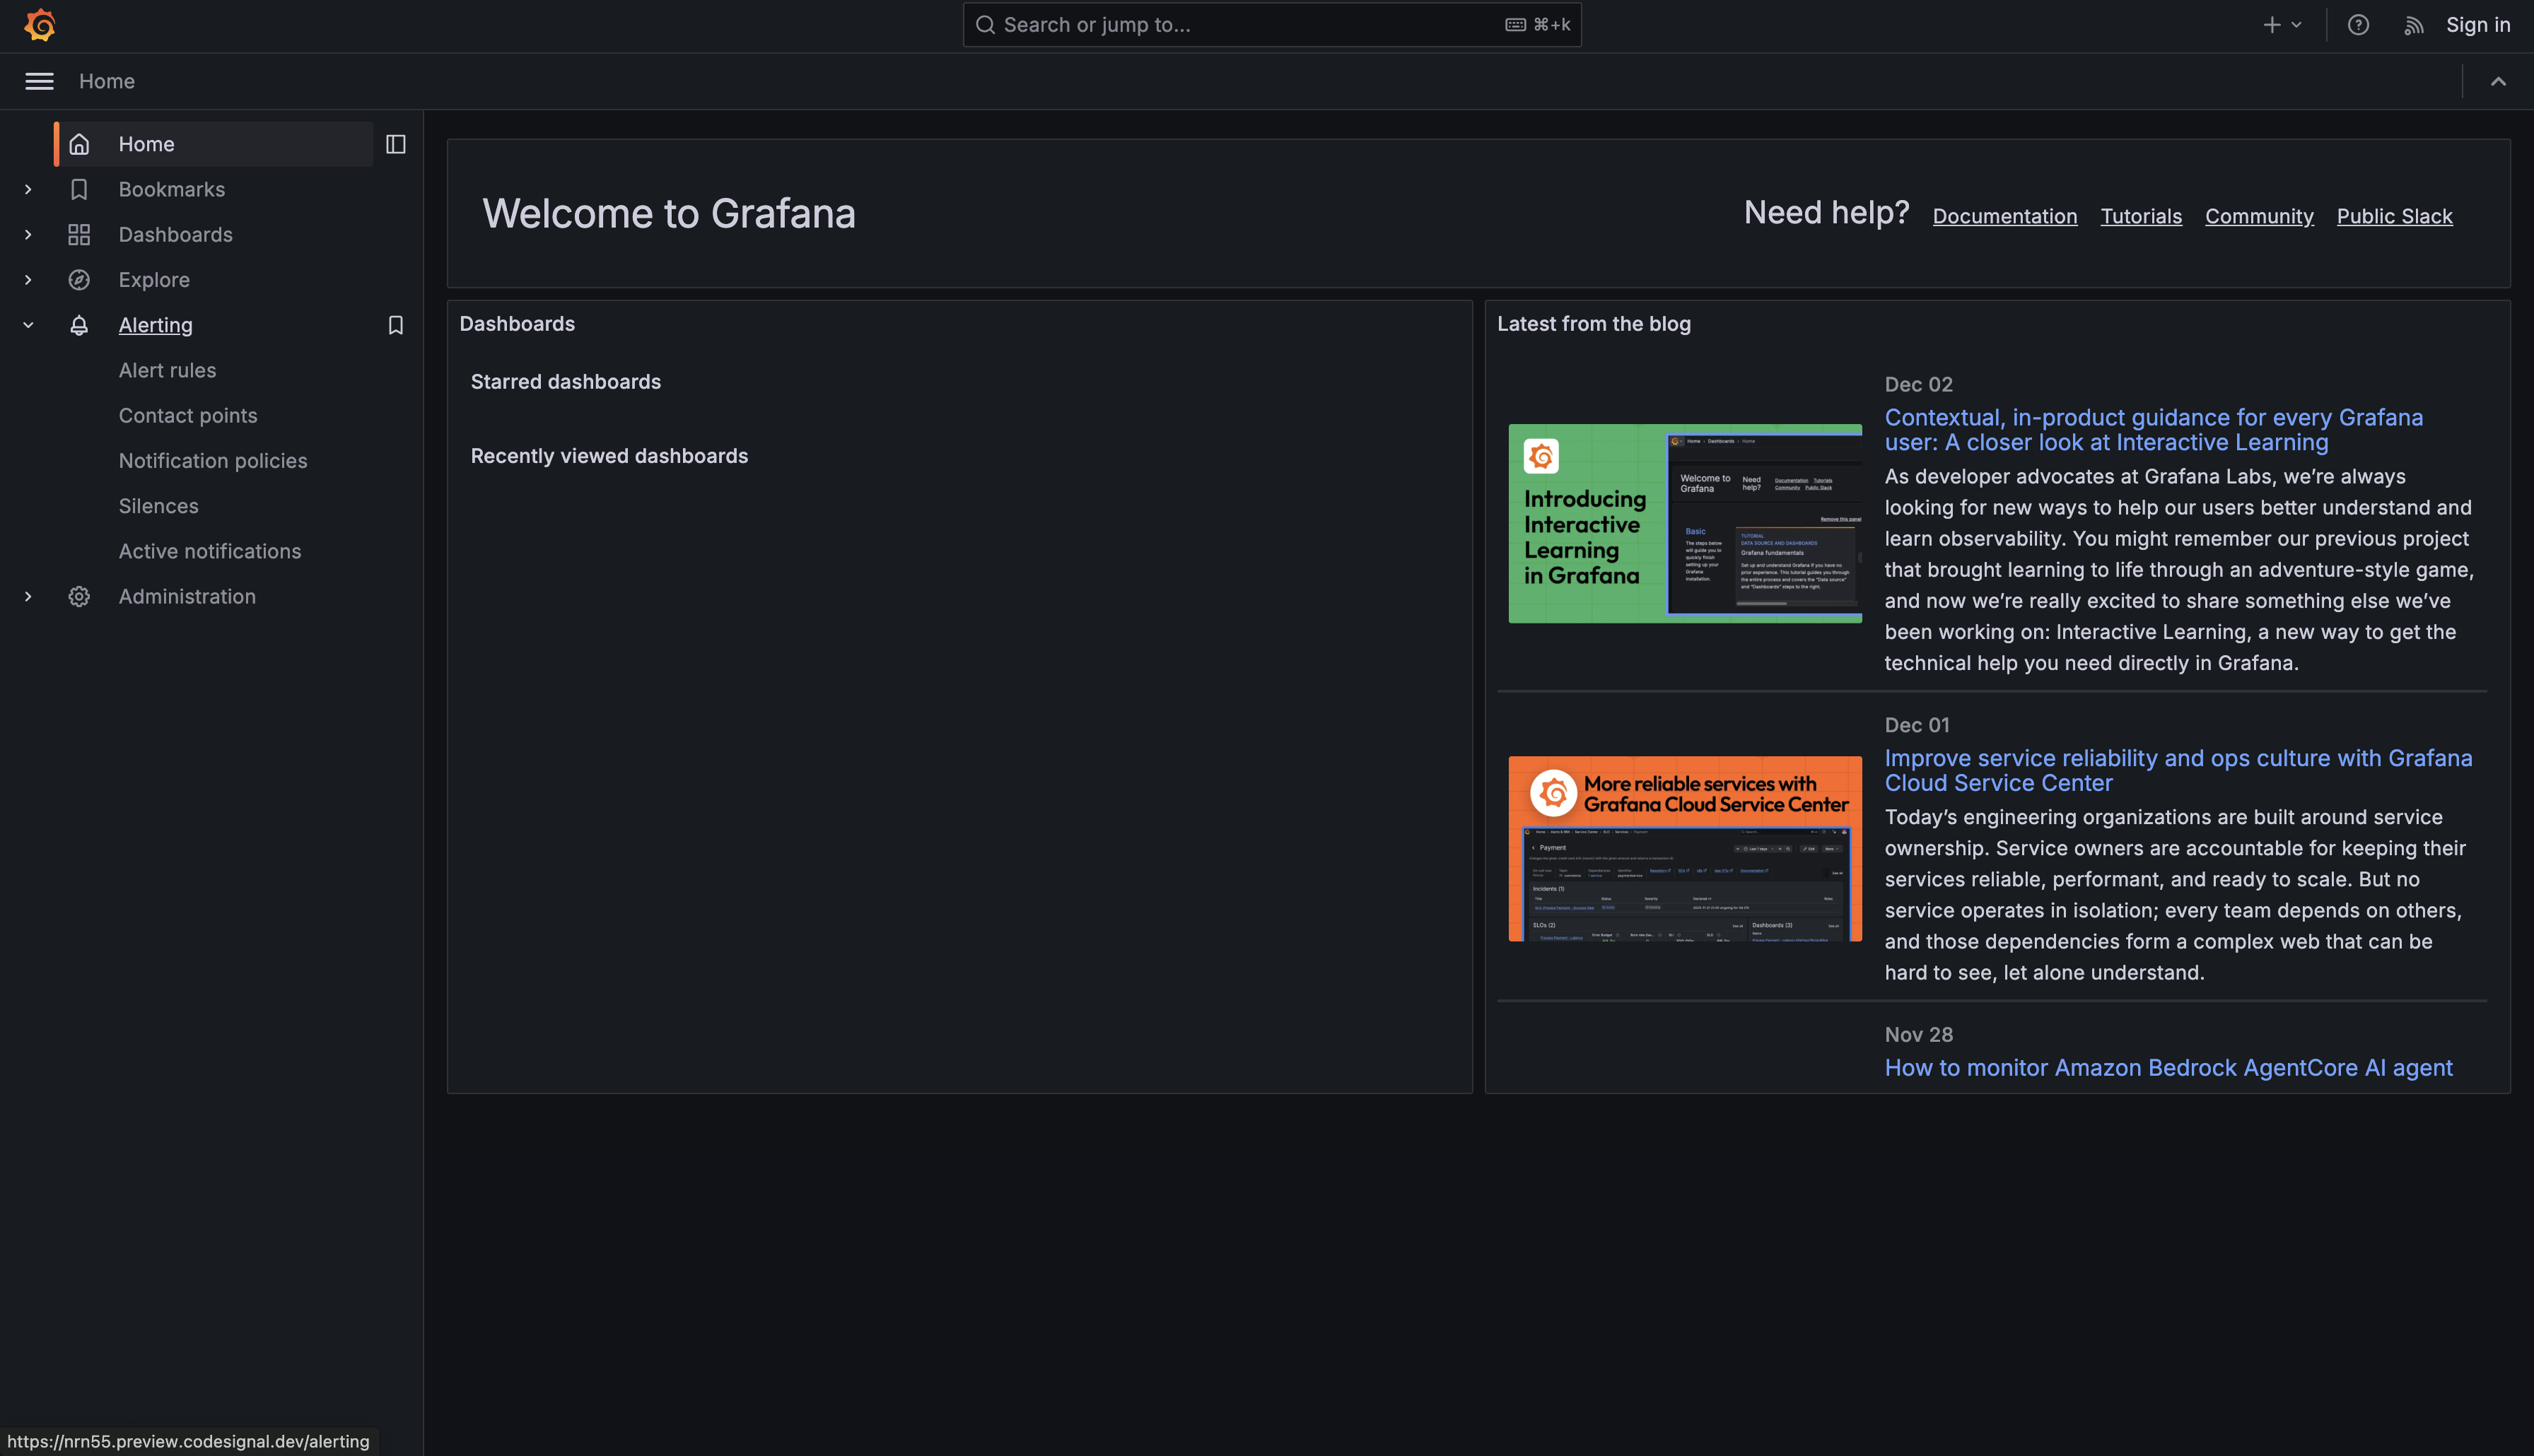
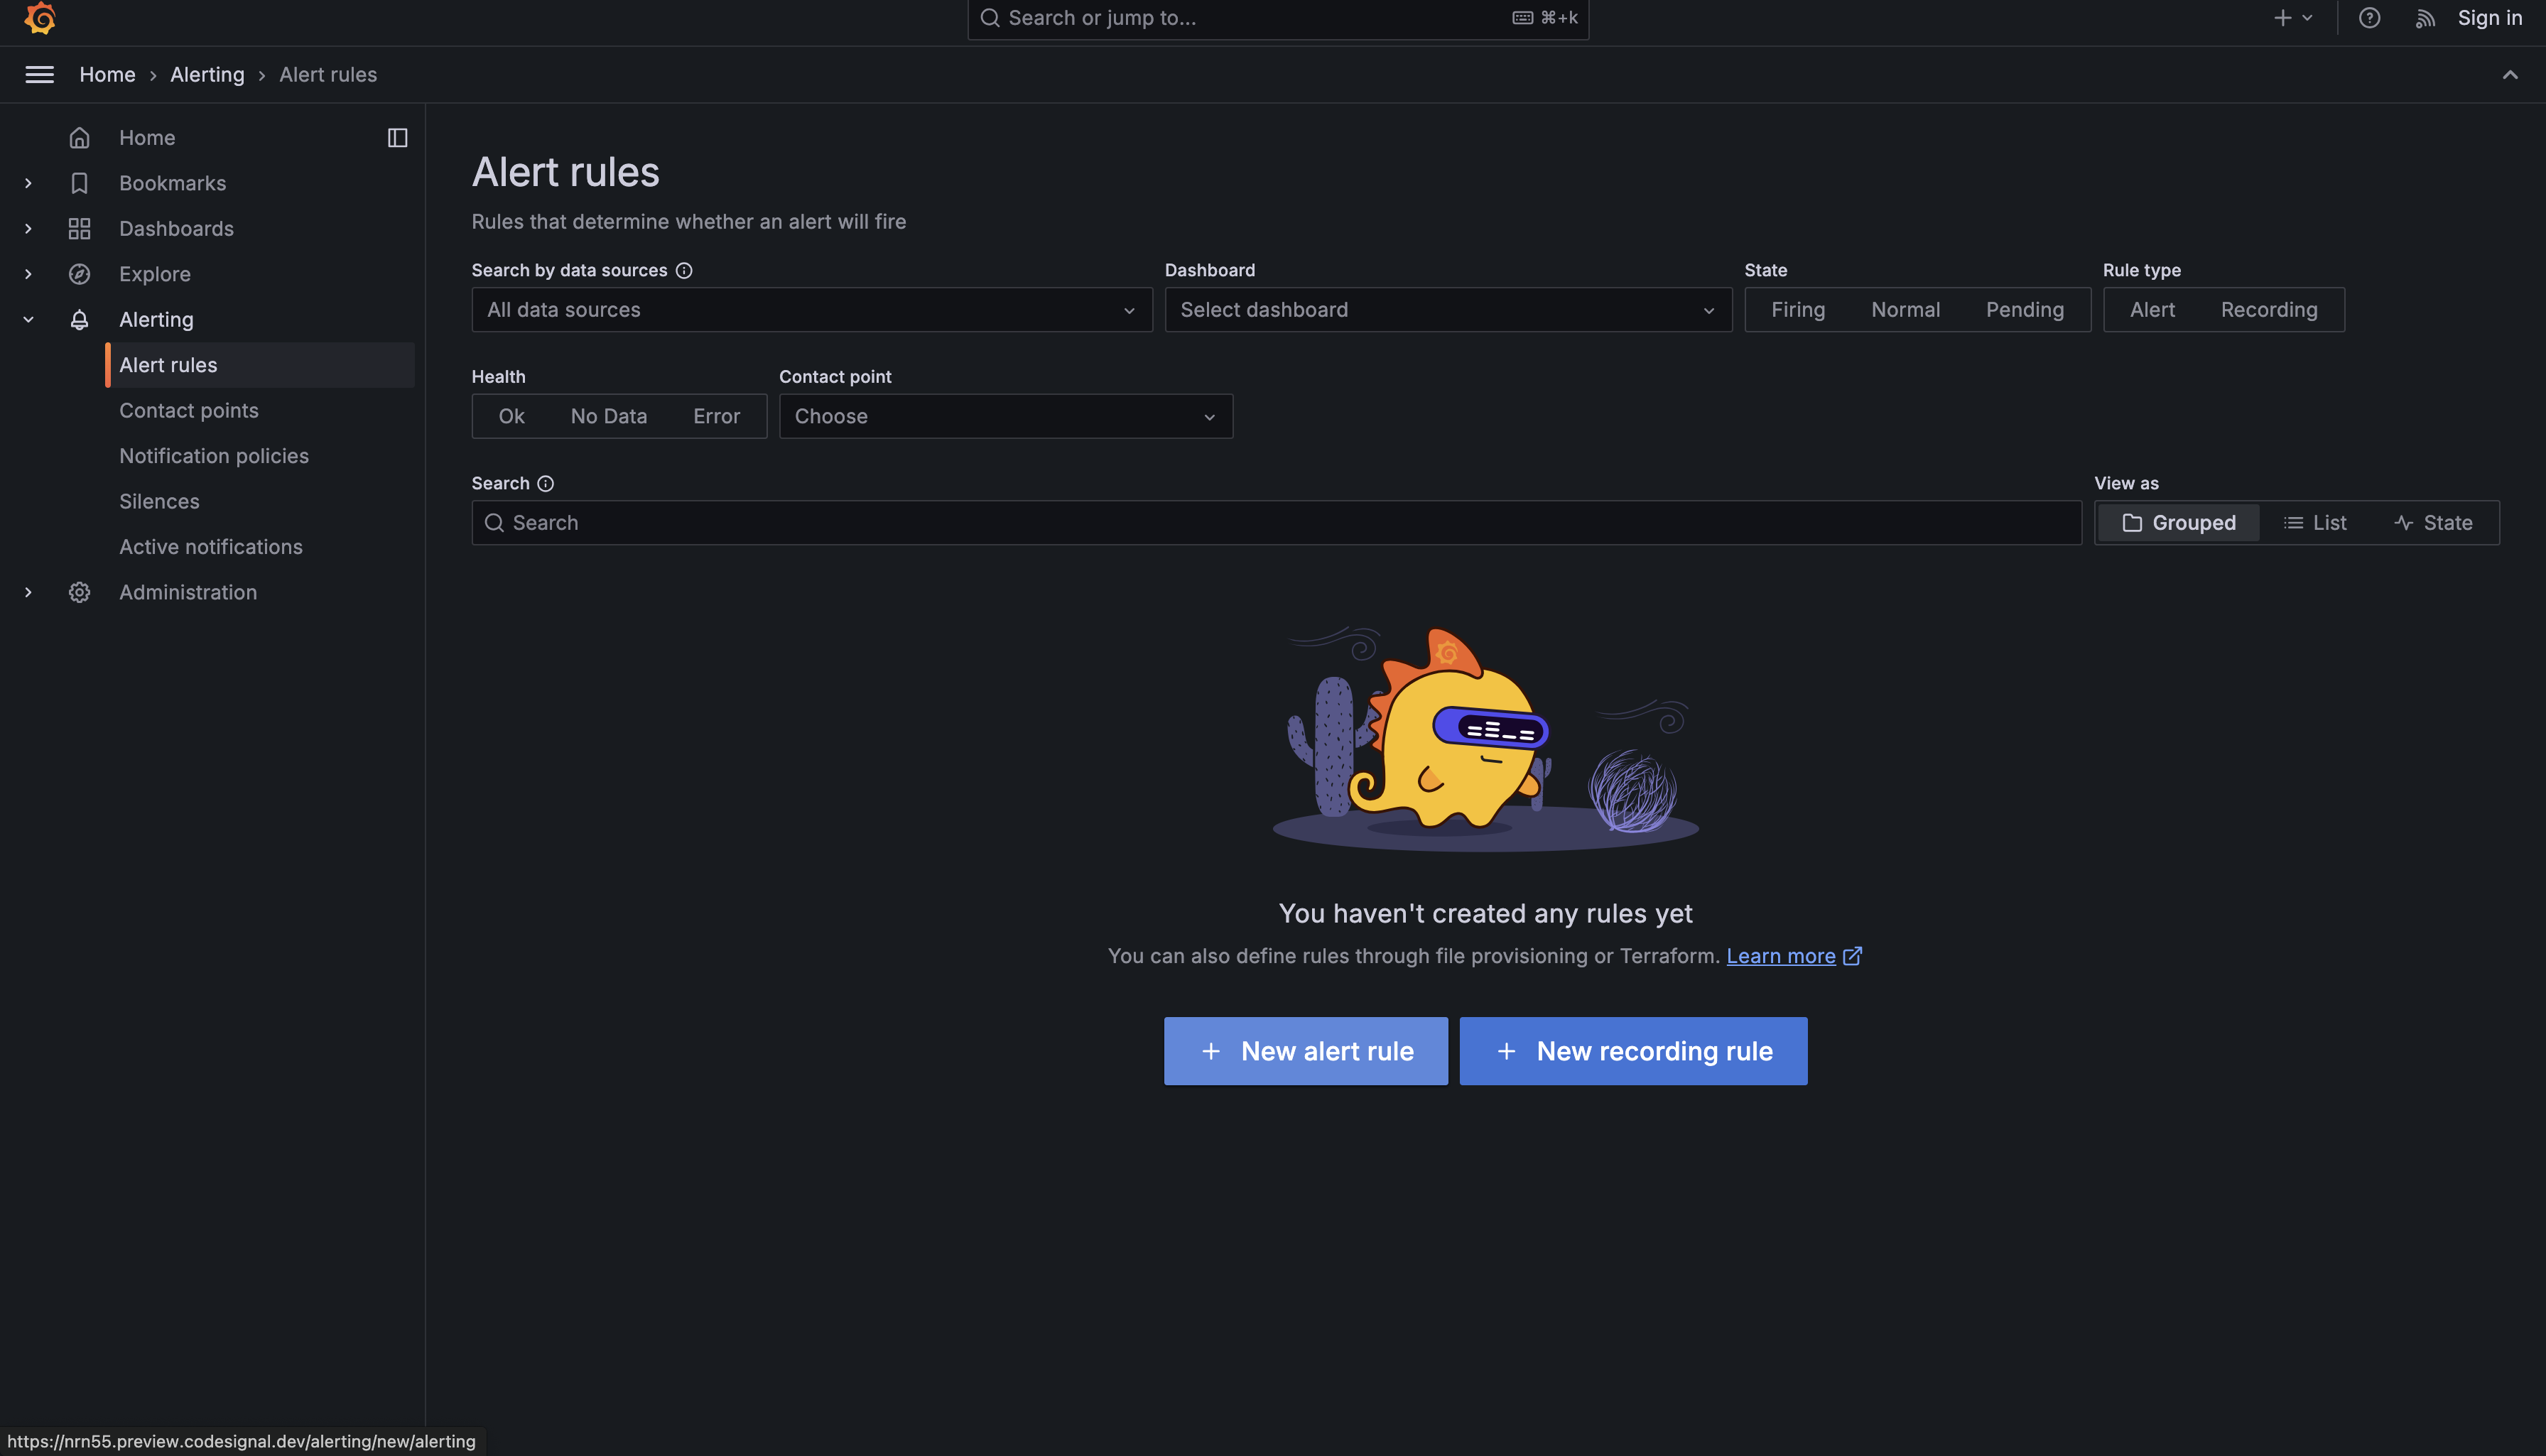
Once you're in the Alerting section, you'll see a navigation menu on the left with items such as Alert rules, Contact points, Notification policies, Silences, and Active notifications. For now, you're focusing on Alert rules. Click Alert rules if it's not already selected.
This page shows the list of alert rules. If you have not created any alert rules yet, the list will be empty. From here, click New alert rule to create your first one.
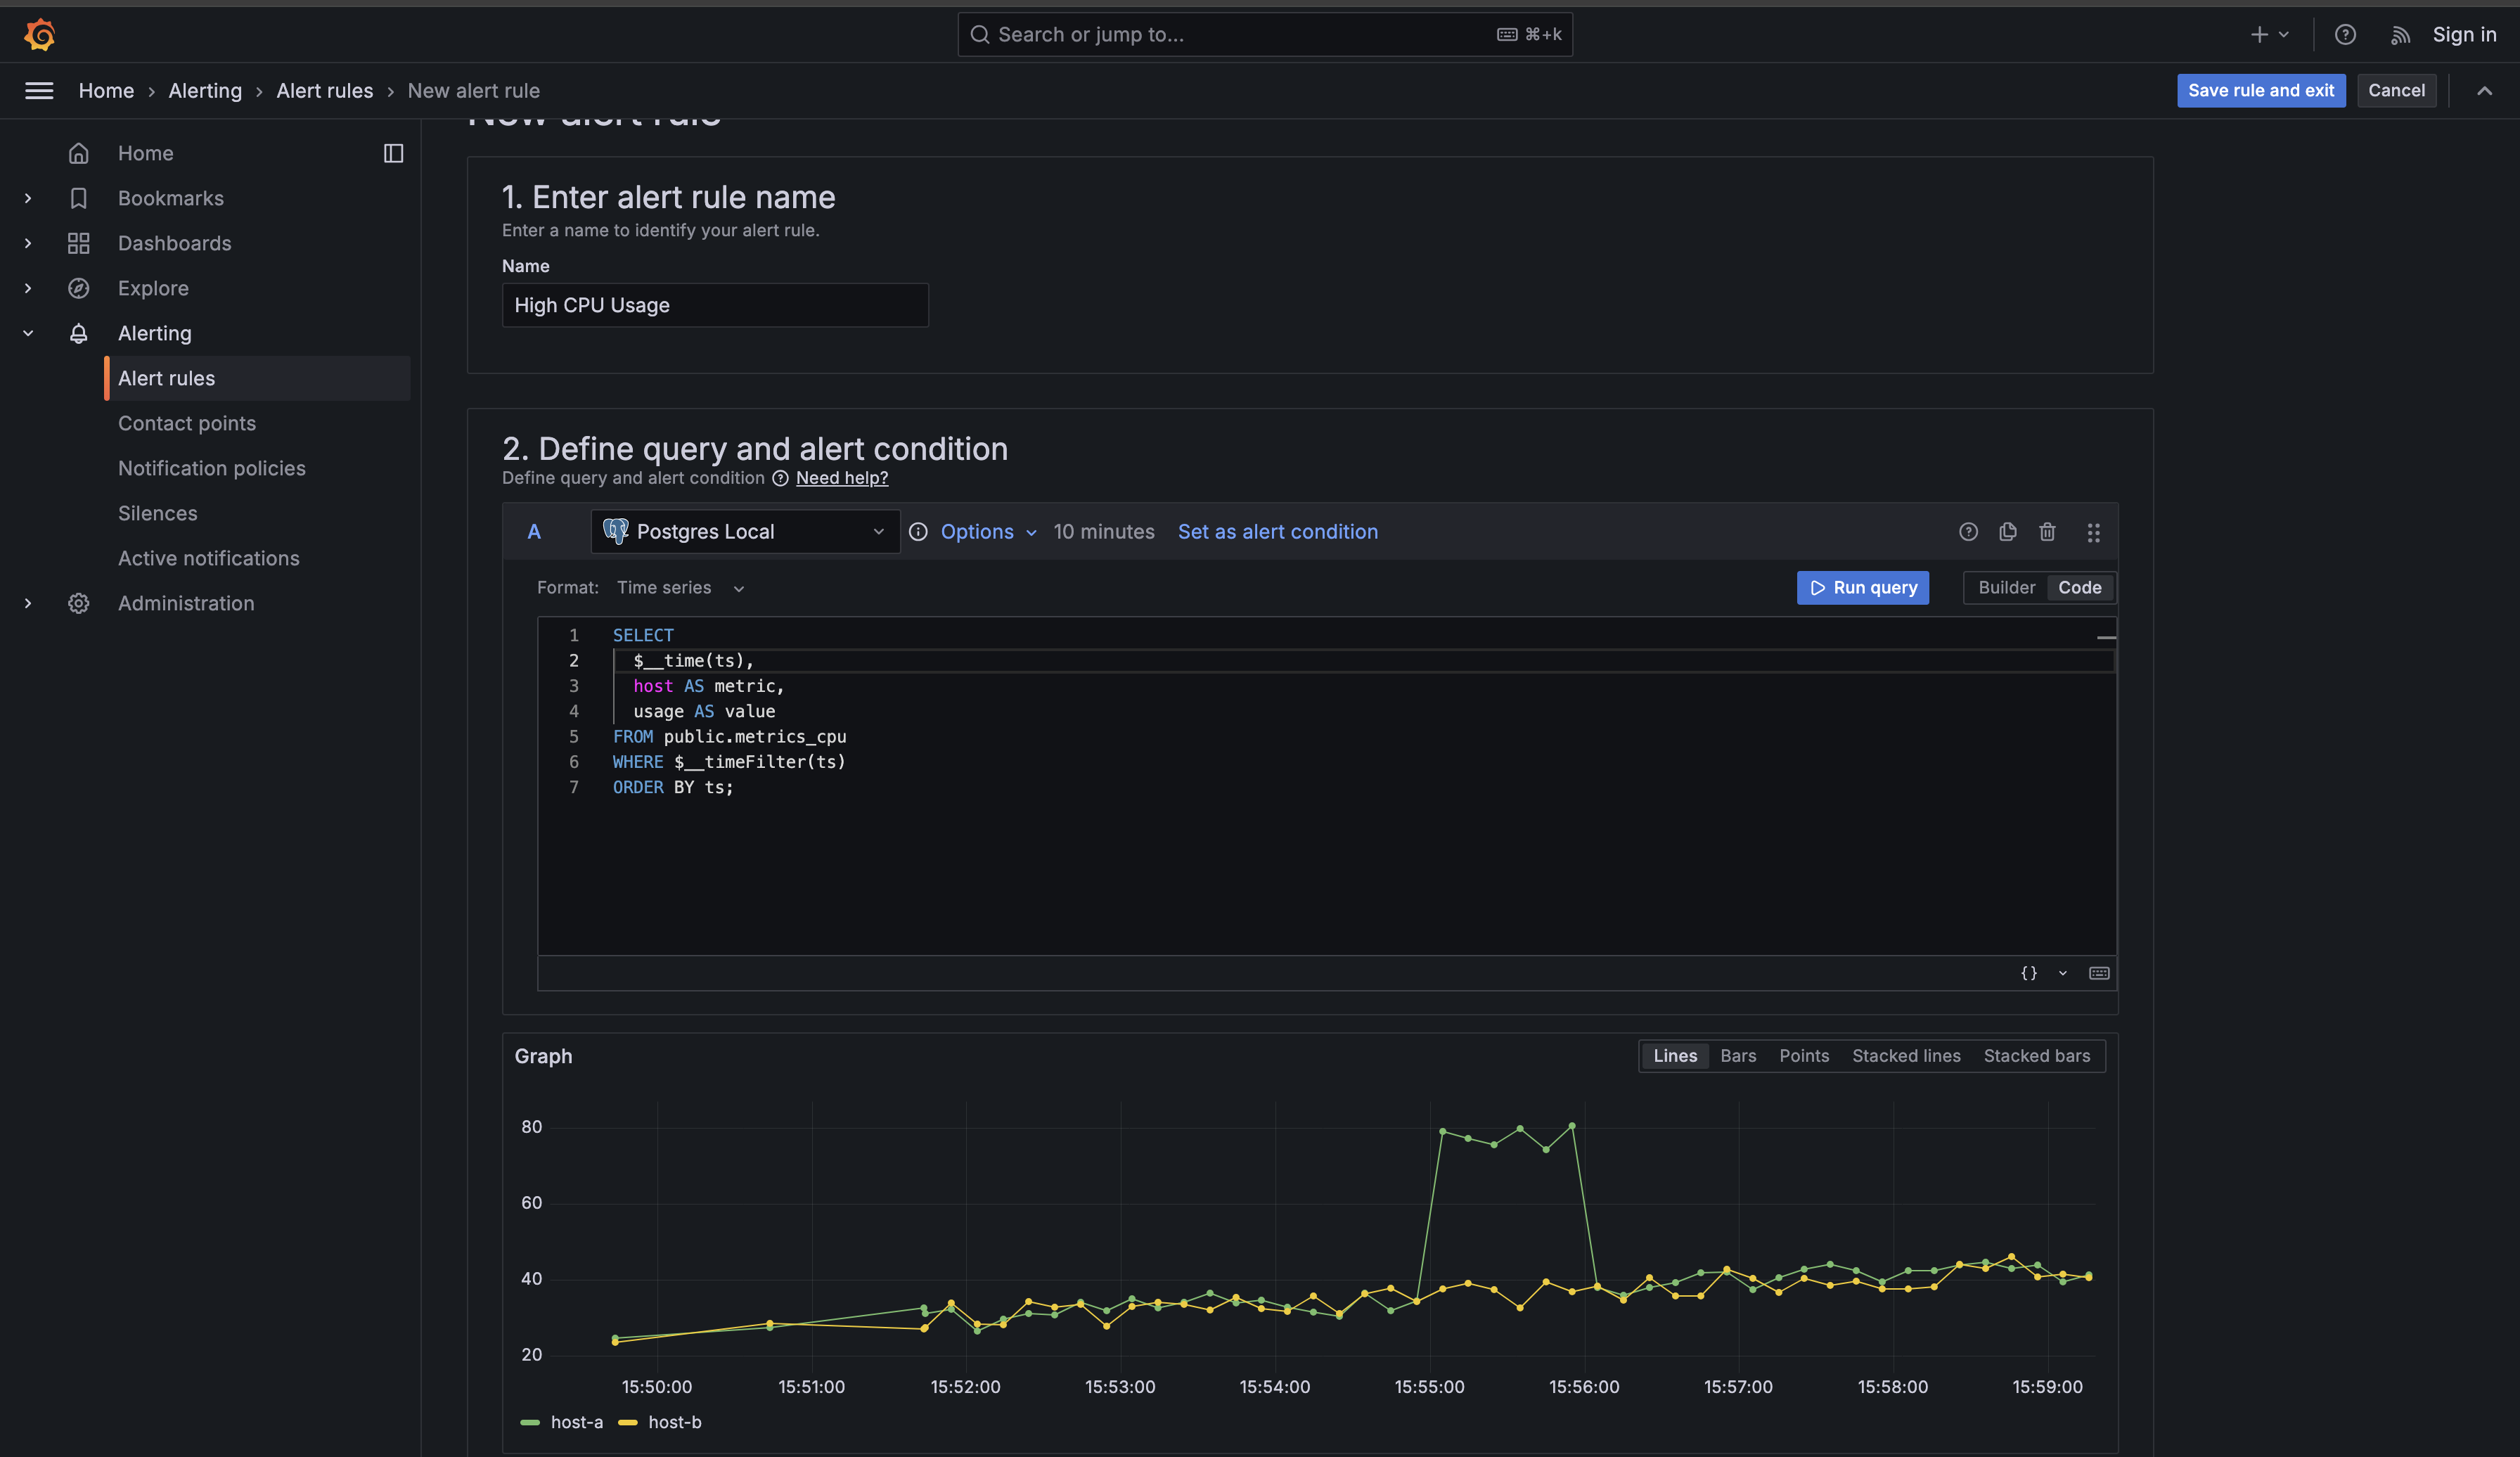
Grafana will present you with a form containing multiple sections. Don't be intimidated by the number of fields — you'll work through them systematically, and many have sensible defaults. The first section asks you to name your alert rule. In the Alert rule name field, enter "High CPU Usage". This name should be descriptive enough that when you receive a notification at 3 AM, you immediately understand what the problem is without needing to look up documentation.
Now you need to write the query that fetches the CPU data to evaluate. Scroll down to the section labeled Define a query and alert condition. This is where you'll define what data to monitor. In the query editor, you'll see a dropdown that lets you select your data source. Choose your PostgreSQL data source from the list — in the CodeSignal environment, it's named "Postgres Local."
Once you've selected your data source, you'll see a query editor similar to what you've used in dashboards. However, alert queries have a specific structure they must follow. Grafana needs three specific pieces of information from your query: a time column, a metric identifier, and the numeric value to evaluate. Enter the following query:
This query structure is critical for alert rules, so let's examine each part carefully. The $__time(ts) function is a Grafana-specific helper that converts your timestamp column into the format Grafana expects for time series data. You may have seen this in dashboard queries before, and it works the same way here — it ensures Grafana correctly interprets your timestamps regardless of timezone or format differences.
The host AS metric clause tells Grafana which field identifies what's being measured. In alert contexts, the metric column acts as a label that distinguishes between different series in your data. When your alert fires, Grafana will include this metric value in the notification, telling you which specific server has high CPU usage. Without this column aliased as metric, Grafana wouldn't know that "web-server-01" and "api-gateway-01" are different entities that should be tracked separately.
The usage AS value clause provides the numeric data that Grafana will evaluate against your threshold. Alert conditions always operate on a column named , which is why you must use this specific alias. If you named it something else, like or , Grafana wouldn't know which column to compare against your 80% threshold.
Now scroll down to the alert condition configuration. You'll see a section labeled Expressions where Grafana has already created two expressions for you. Your query is labeled "A," and below it you'll see expression "B" (a Reduce operation) and expression "C" (a Threshold operation) already set up.
Expression B (Reduce) takes the time series data returned from your query and converts each series into a single number. Since your query returns multiple measurements for each host over the evaluation period, the Reduce function determines which value to use for the threshold comparison. Expression C (Threshold) then takes those reduced single values and checks if any of them match your threshold condition, which determines whether the alert should fire.
Configure expression "B" (Reduce):
- Set Function to
Last(this tells Grafana to use the most recent value from each series) - Set Input to
A(your query) - Set Mode to
Strict(ensures each series is evaluated individually)
Then configure expression "C" (Threshold):
- Set Input to
B(the reduced values) - Change Is above from
0to80in the threshold field
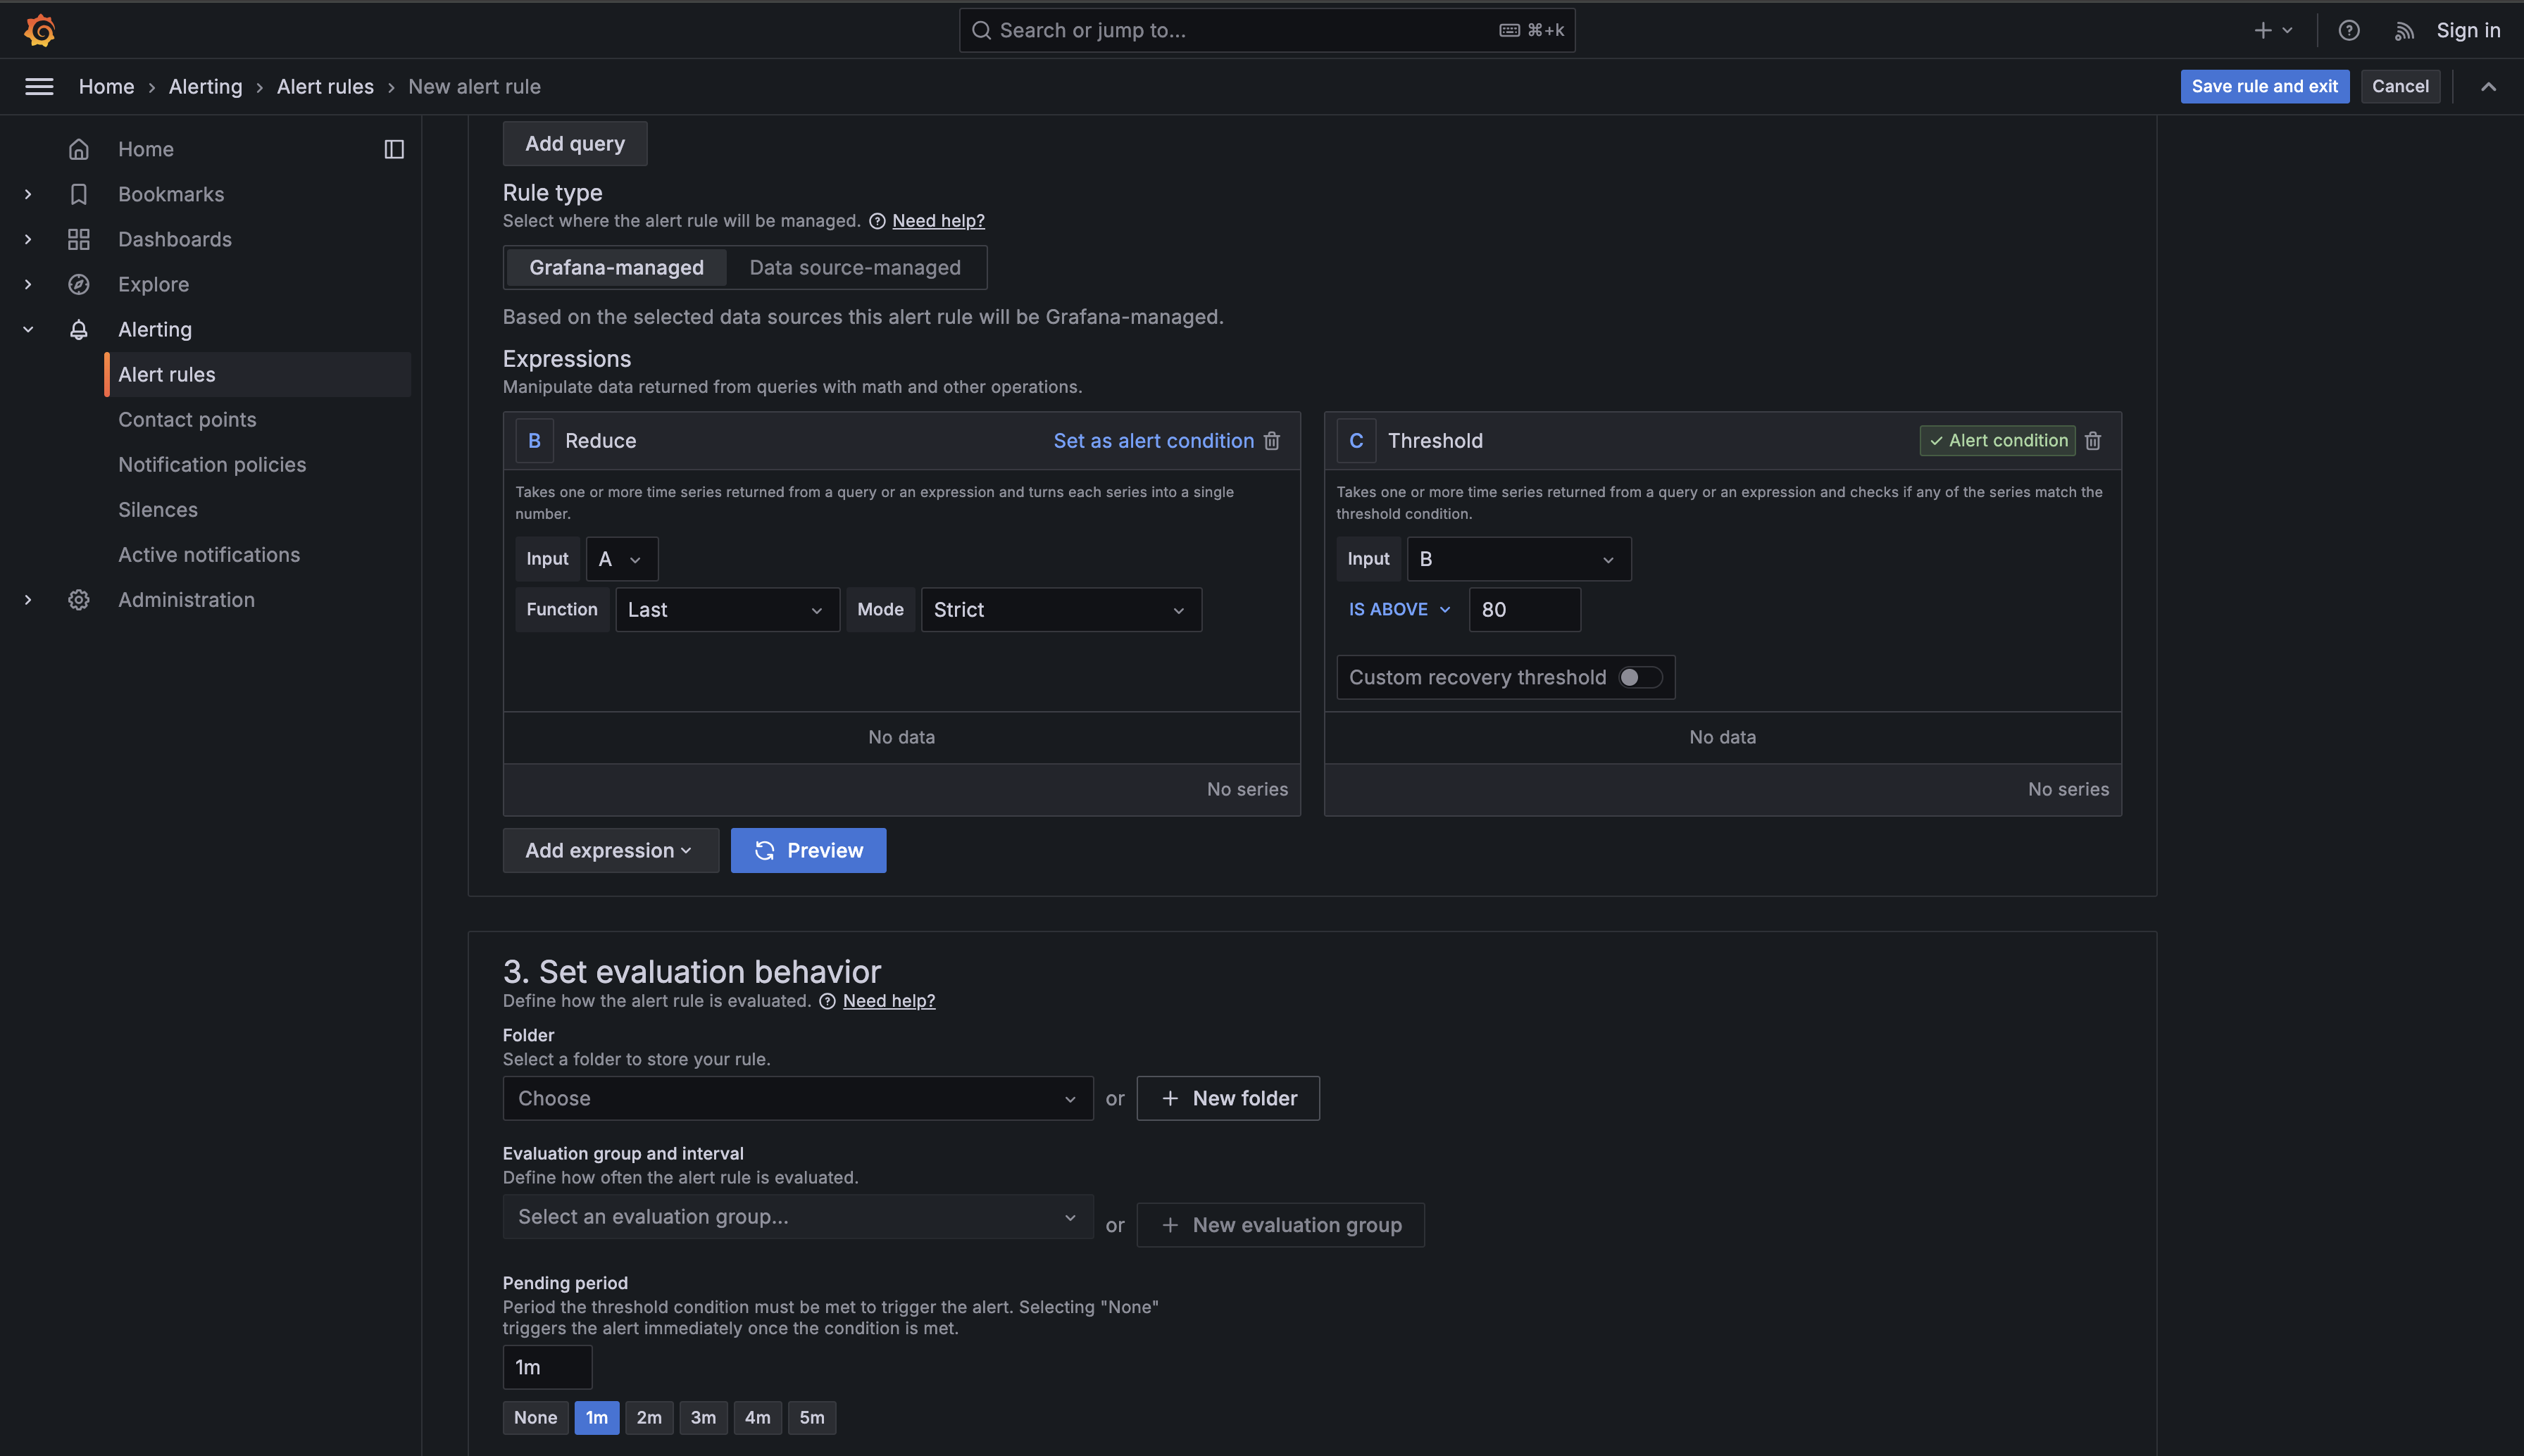
Now scroll down to the Set evaluation behavior section. This is where you define how often Grafana checks your condition and how long it must be true before firing an alert.
First, you need to select a Folder to organize your alert rule. Click Choose and select an existing folder, or create one by clicking New folder. For this lesson, you can use the default folder or create one named "Infrastructure Alerts."
Next, configure the Evaluation group and interval. This determines how often Grafana runs your query and checks the condition. Click New evaluation group to create a new group. You'll be prompted to:
- Give the group a name (e.g., "10-second-check")
- Set the Evaluation interval to
10s(ten seconds)
This means Grafana will run your query and check the condition every ten seconds. We're using a 10-second interval in this learning environment for better observability — you'll be able to see state changes quickly as you experiment with the alert. In production environments, you would typically use longer intervals like 1 minute or 5 minutes to reduce database load and avoid unnecessary evaluations. More frequent evaluations catch problems faster but consume more system resources, so the interval should be chosen based on your specific requirements and infrastructure capacity.
Finally, set the Pending period to 10m (ten minutes). This is perhaps the most important setting for preventing false alarms. The pending period specifies how long the condition must remain true before Grafana actually fires the alert. Even though Grafana checks every ten seconds, it won't send a notification until the CPU has been above 80% for sixty consecutive checks. If CPU spikes to 90% for five minutes and then drops back to 60%, your alert will never fire — it will enter a "Pending" state briefly, then return to "Normal" without bothering anyone.
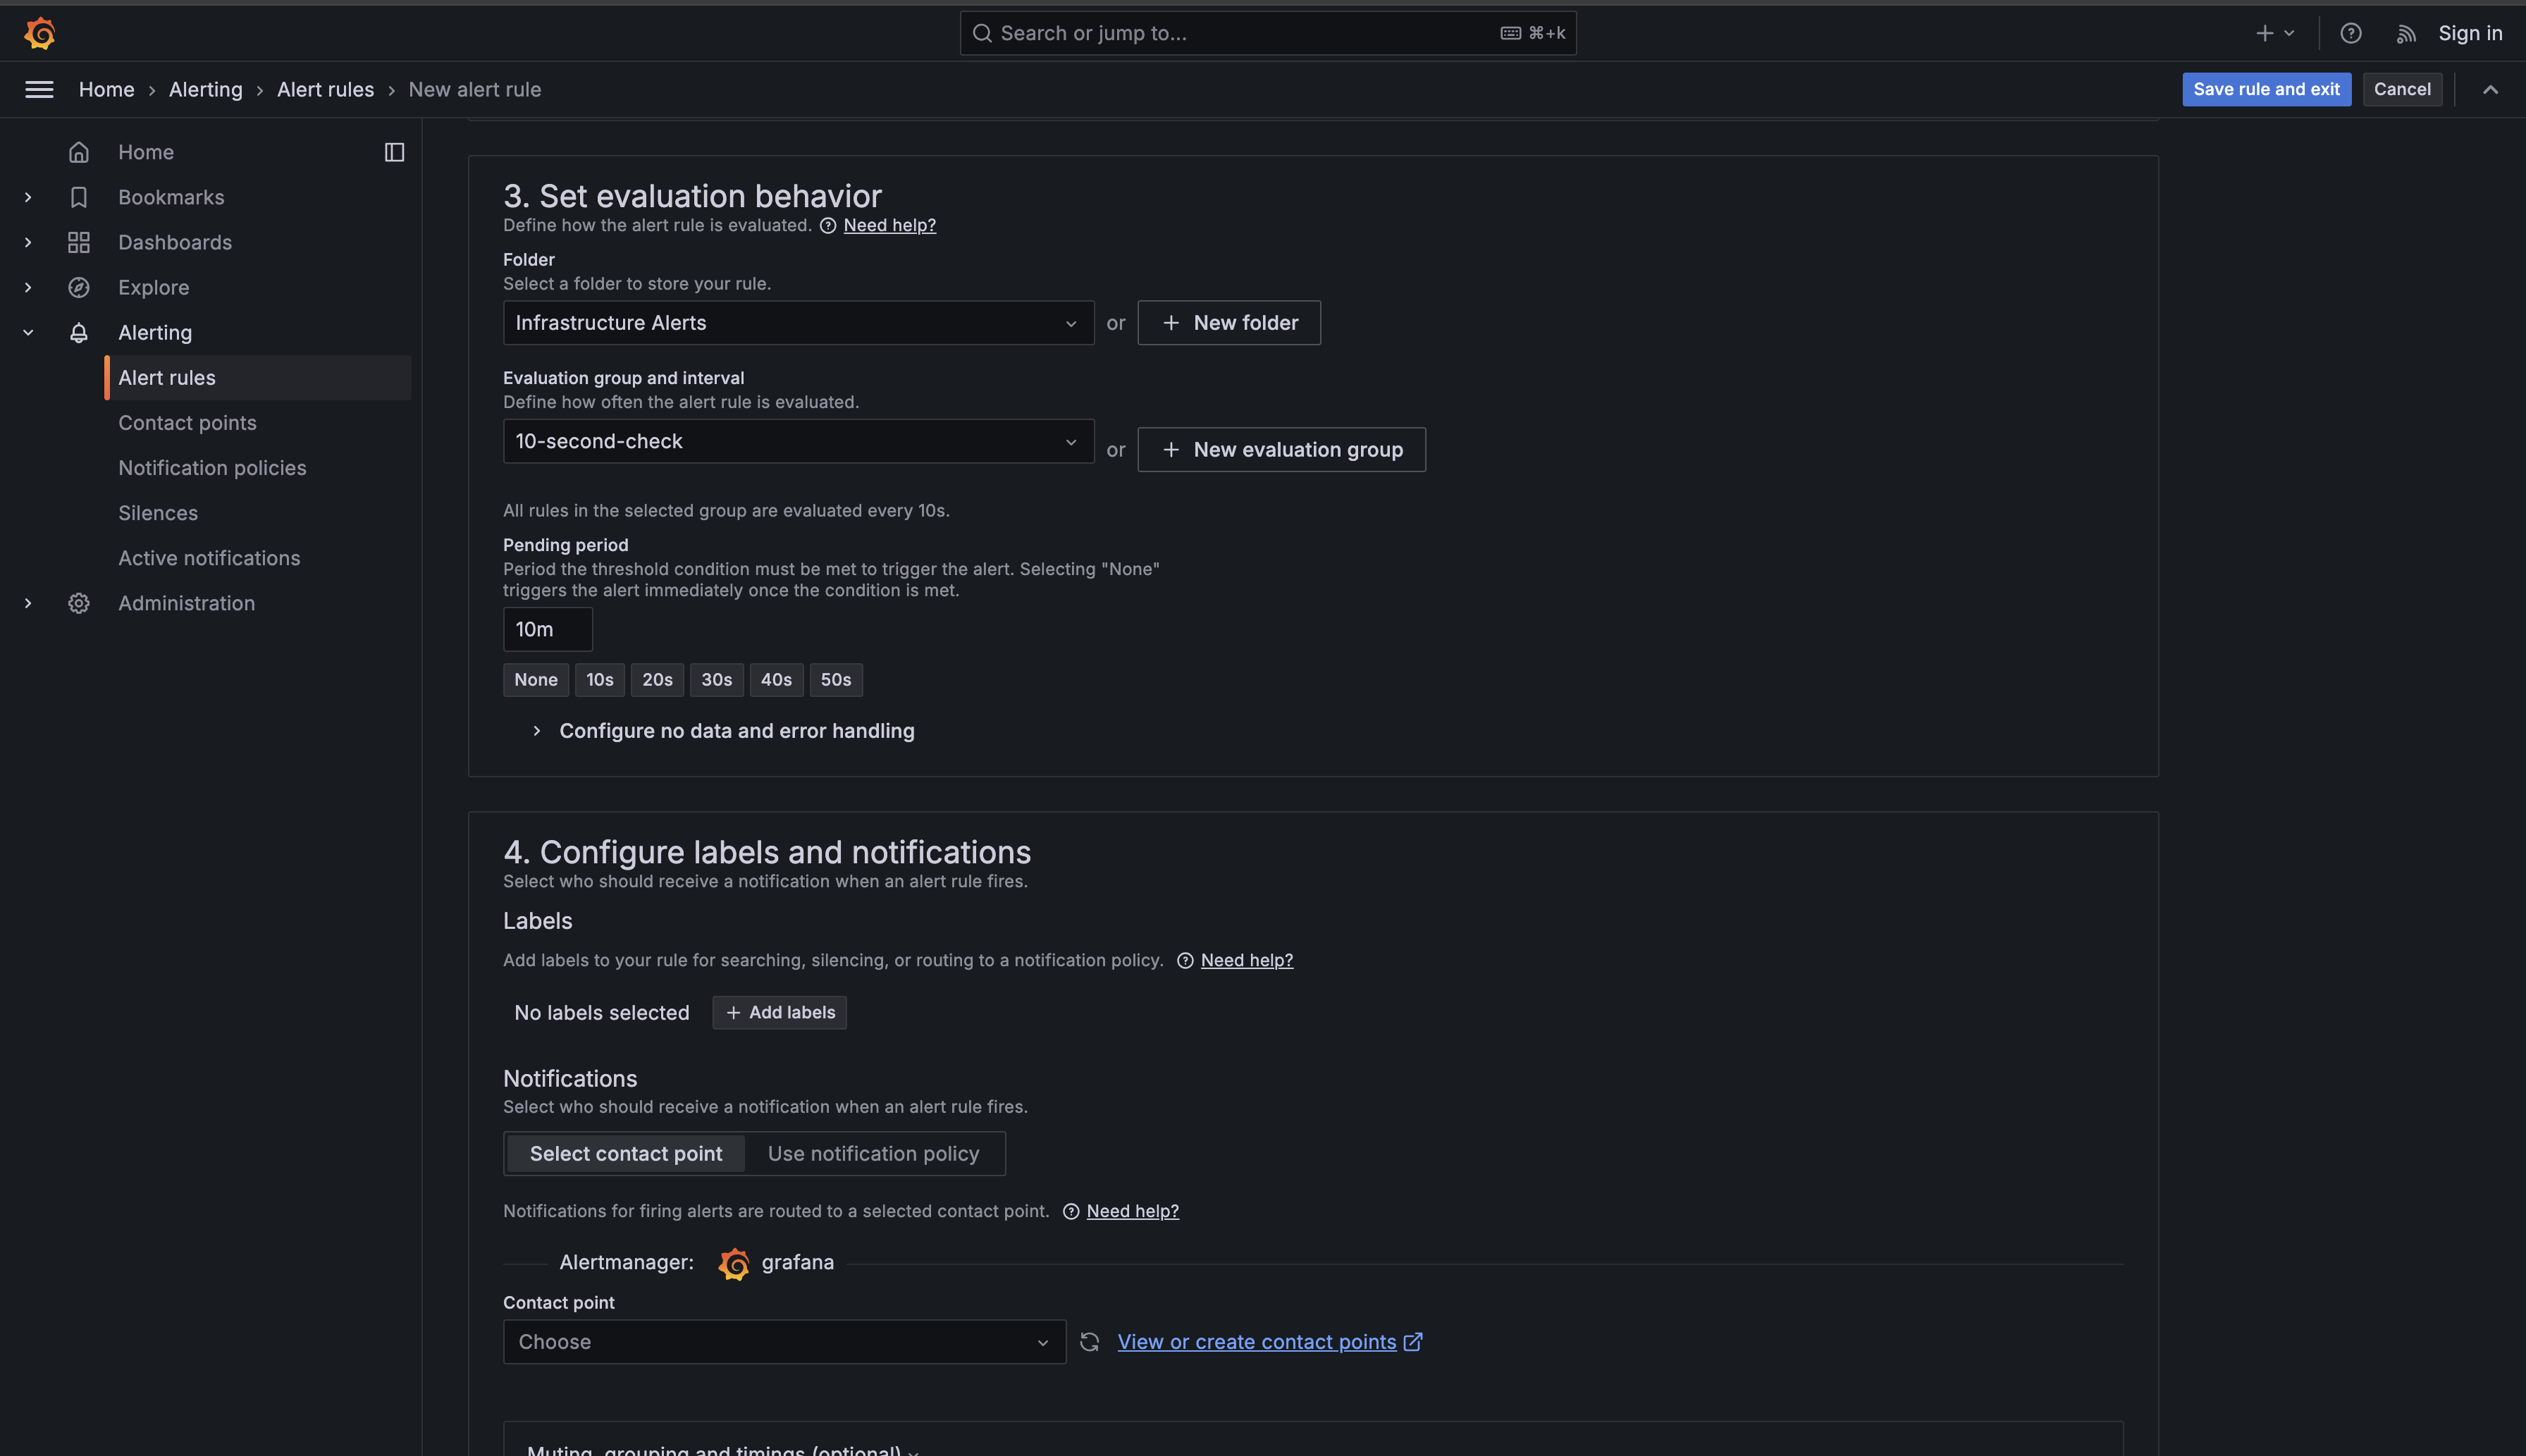
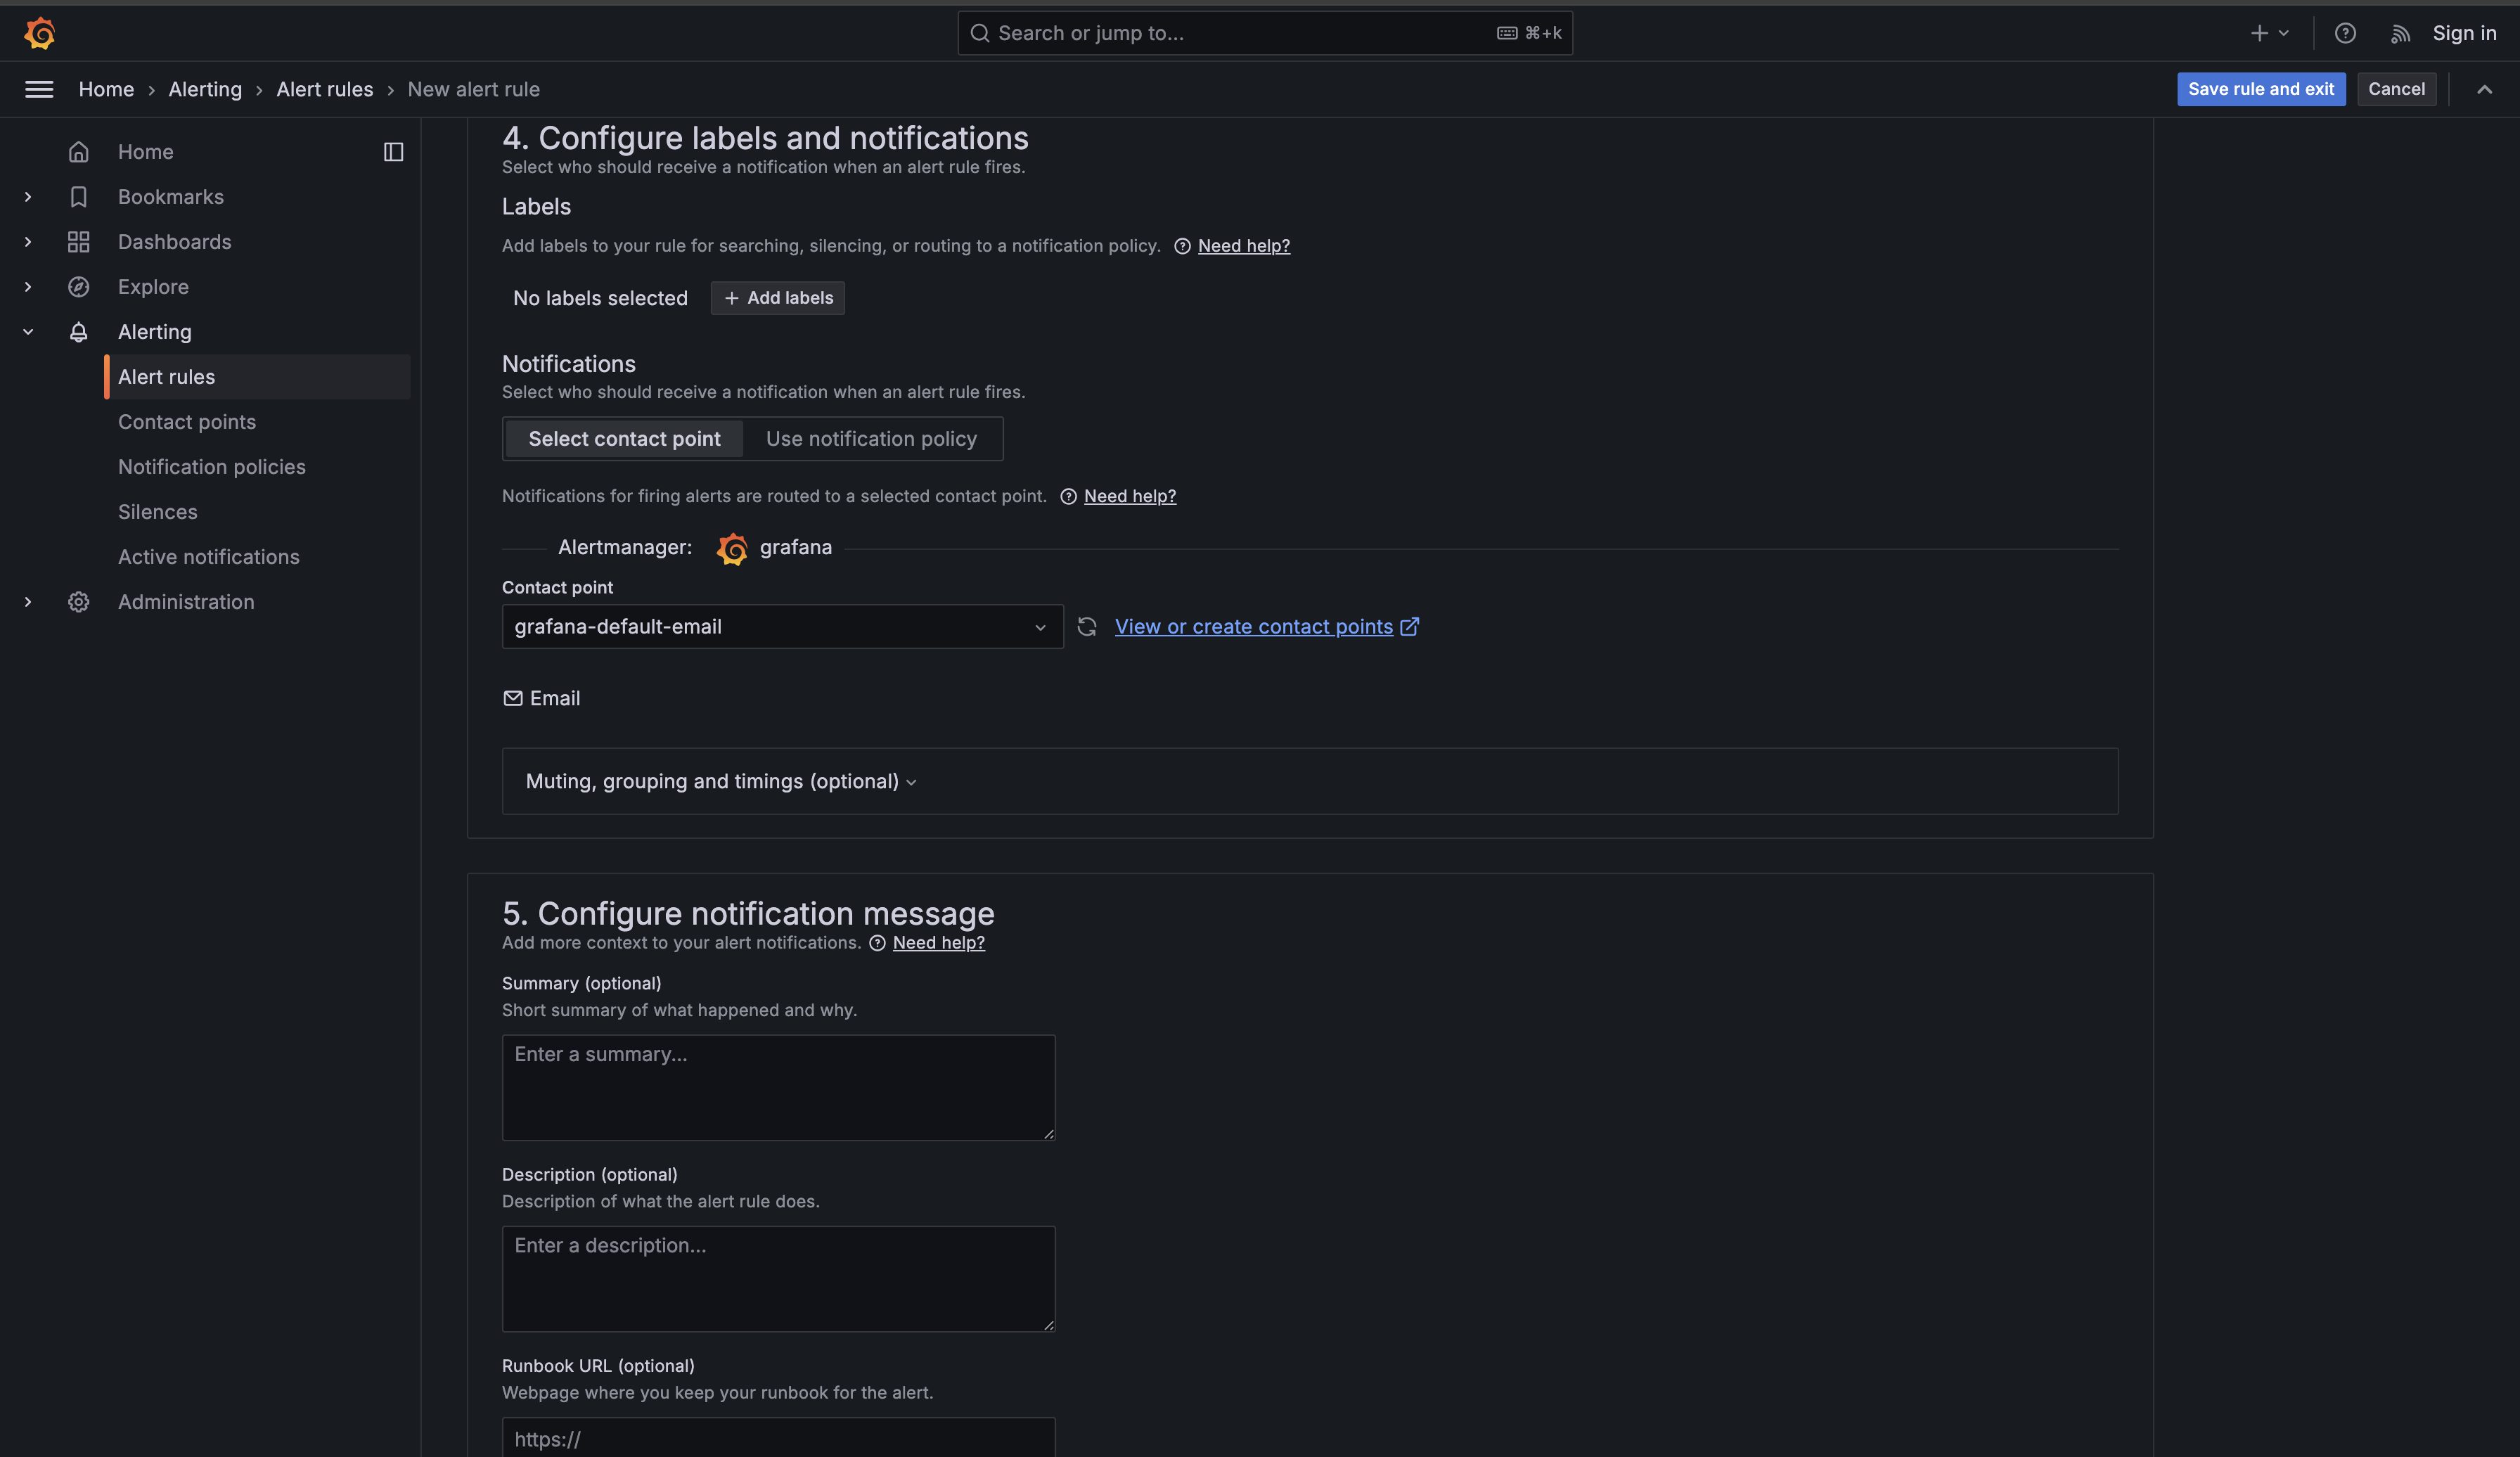
Now scroll down to the Configure labels and notifications section. This is where you can add metadata to your alert and specify who should be notified when it fires.
The Labels section allows you to add key-value pairs that help organize and route alerts. For now, you can skip adding labels — you'll learn about advanced label-based routing in later units.
In the Notifications section, you must select a Contact point that determines where notifications are sent when your alert fires. Click the Choose dropdown under Contact point and select "grafana-default-email" or whichever default contact point appears in the list. Contact points define the actual notification channels (email, Slack, PagerDuty, etc.) where alerts are sent. You'll learn how to create and configure custom contact points in later units, but for this lesson, using the default contact point is sufficient to complete your alert rule configuration.
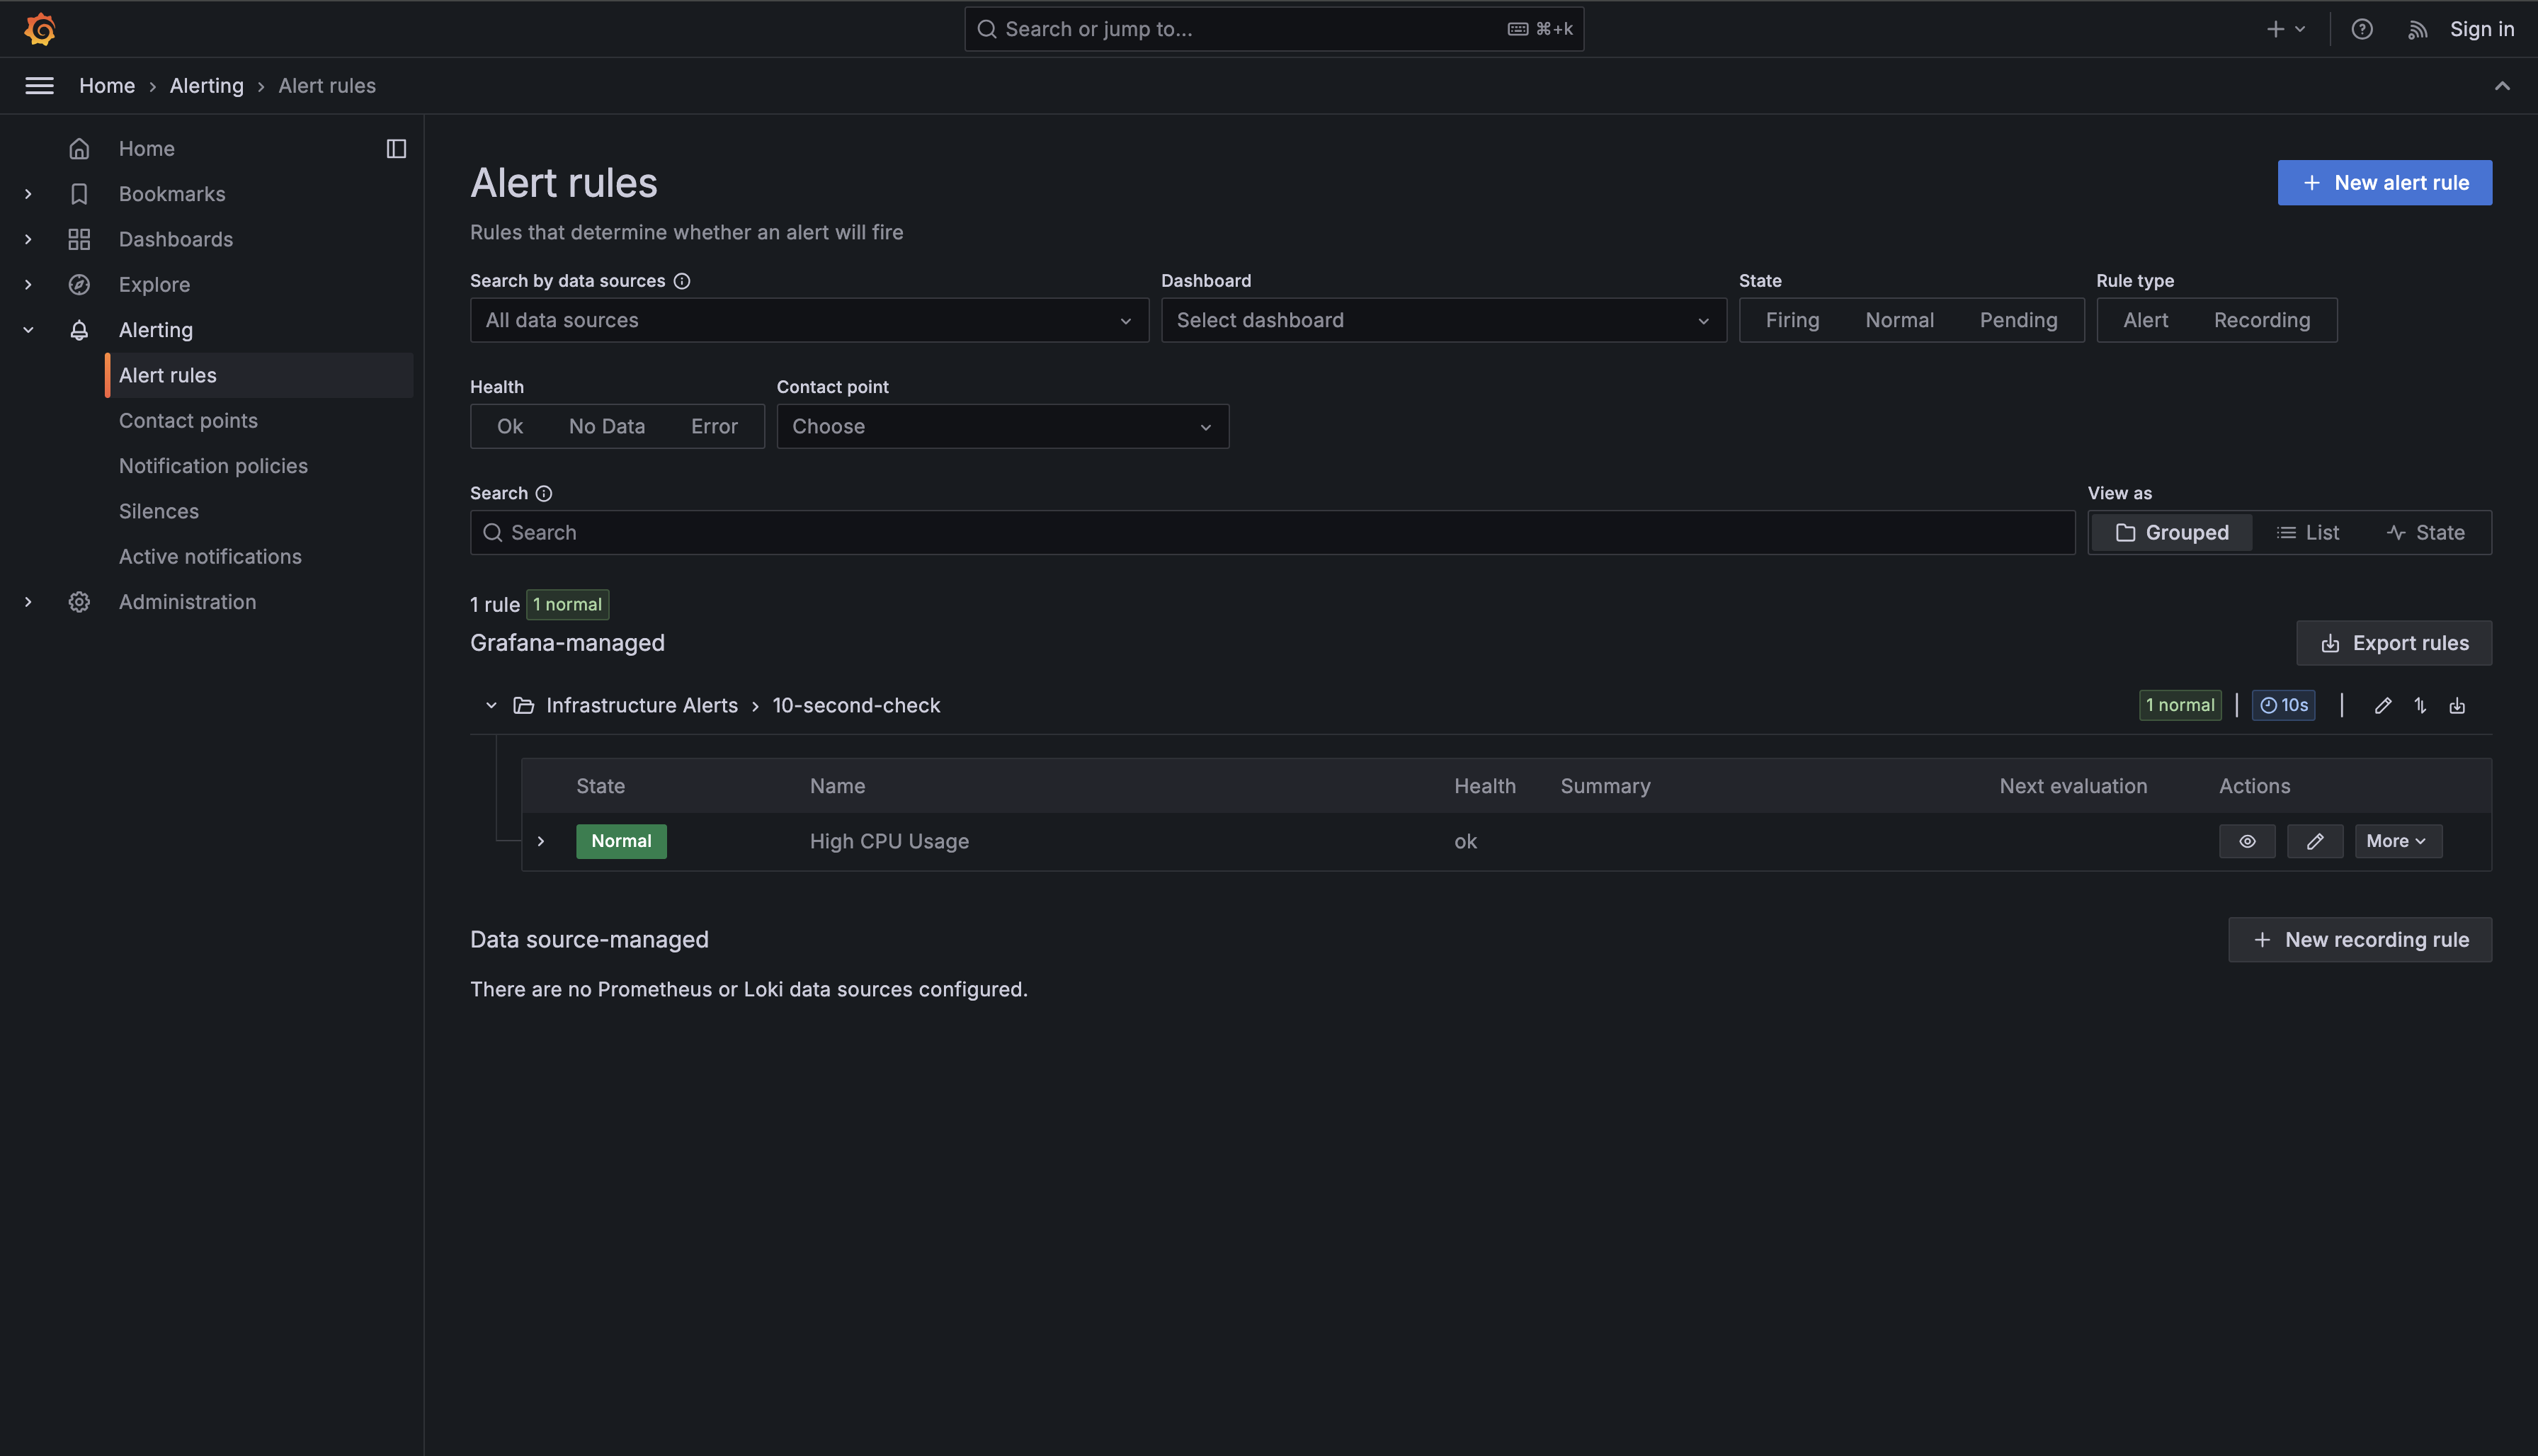
Finally, scroll to the bottom and click Save rule and exit in the top right corner. Grafana will save your alert rule and return you to the Alert rules list, where you should now see "High CPU Usage" listed with a status of "Normal" (assuming none of your servers currently have high CPU).
Now that you've created your alert rule, let's examine exactly how it operates. Understanding the mechanics helps you design better alerts and troubleshoot when things don't behave as expected. Your alert rule runs on a continuous evaluation loop that starts fresh every ten seconds based on your Evaluate every 10s setting.
Every ten seconds — 15:50:00, 15:50:10, 15:50:20, and so on — Grafana executes your query against the PostgreSQL database. The query retrieves recent CPU data for all hosts because of the $__timeFilter(ts) clause. For each host returned by your query, the Reduce expression takes the most recent value from that host's measurements. Grafana then compares this value against your 80% threshold. If web-server-01's most recent measurement is 85%, the condition is met for that particular host.
But here's where the Pending period 10m setting becomes critical. Even though the condition is true, Grafana doesn't immediately fire the alert. Instead, it marks the alert as "Pending" and starts an internal timer. The alert rule remembers that web-server-01 met the condition at 15:50:00. When the next evaluation runs at 15:50:10, if the condition is still true (the value is still above 80%), Grafana extends the pending timer. This process continues every ten seconds for the next ten minutes.
Only after ten full minutes have passed — at 16:00:00 — does Grafana transition the alert from "Pending" to "Alerting." At this point, Grafana will trigger any notification channels you've configured (which you'll learn about in later units). The alert has now fired, and you'll receive notifications informing you that web-server-01 has sustained high CPU usage.
This delayed firing behavior is what makes the pending period so valuable. Imagine a scenario where a batch job runs every hour and causes CPU to spike to 95% for exactly five minutes before completing. Without the 10-minute requirement, you'd receive an alert every single hour for what's actually expected behavior. With the 10-minute requirement, these brief spikes never transition from "Pending" to "Alerting," and you never get notified. You've effectively filtered out noise while still catching genuine problems that persist.
The alert remains in the "Alerting" state as long as the condition continues to be true. If at 16:05:00 the CPU usage on web-server-01 drops back to 65%, the next evaluation at 16:05:10 will see that the condition is no longer met. Grafana immediately transitions the alert back to the "Normal" state. There's no pending period required to clear an alert — as soon as the problem resolves, the alert resolves. This asymmetry makes sense: you want to be cautious about firing alerts (hence the 10-minute requirement), but you want to know immediately when problems clear.
You've now created your first Grafana alert rule that actively monitors CPU usage across your infrastructure. The four key components are: the query structure using $__time(ts), host AS metric, and usage AS value; the condition comparing CPU against your 80% threshold; the evaluation timing checking every 10 seconds with a 10-minute pending period to prevent false alarms; and the state transitions moving from Normal to Pending to Alerting and back.
This alert balances responsiveness and stability for this learning environment. The 80% threshold catches problems before they become critical, the 10-minute pending period filters out brief spikes, and the 10-second check interval lets you observe alert state changes quickly while you experiment. In production, you would typically use a longer evaluation interval such as 1 minute or 5 minutes to reduce database load. These principles apply to monitoring any metric — disk space, memory usage, error rates, or response times.
In the practice exercise, you'll build your first alert rule independently, reinforcing the fundamental pattern you learned: write a query with the correct column structure, configure an appropriate condition, and set evaluation intervals that balance speed and stability. In the next unit, you'll learn how to build more sophisticated alert queries using multi-condition filters, focusing on monitoring application logs by filtering for specific severity levels and time windows rather than evaluating numeric thresholds.