We've covered why models are essential. Now let's build the powerful Aggregate Demand curve - your key to understanding economic booms and busts!
Aggregate Demand (AD) shows total spending in the economy at different price levels. It's like a giant shopping list for the entire country.
Engagement Message
What do you think happens to total spending when prices rise?
AD has four spending components: C + I + G + NX
C = Consumer spending (your groceries, Netflix subscription)
I = Investment (business equipment, new factories)
G = Government spending (roads, military, schools)
NX = Net exports (exports minus imports)
Engagement Message
Which component do you interact with most often?
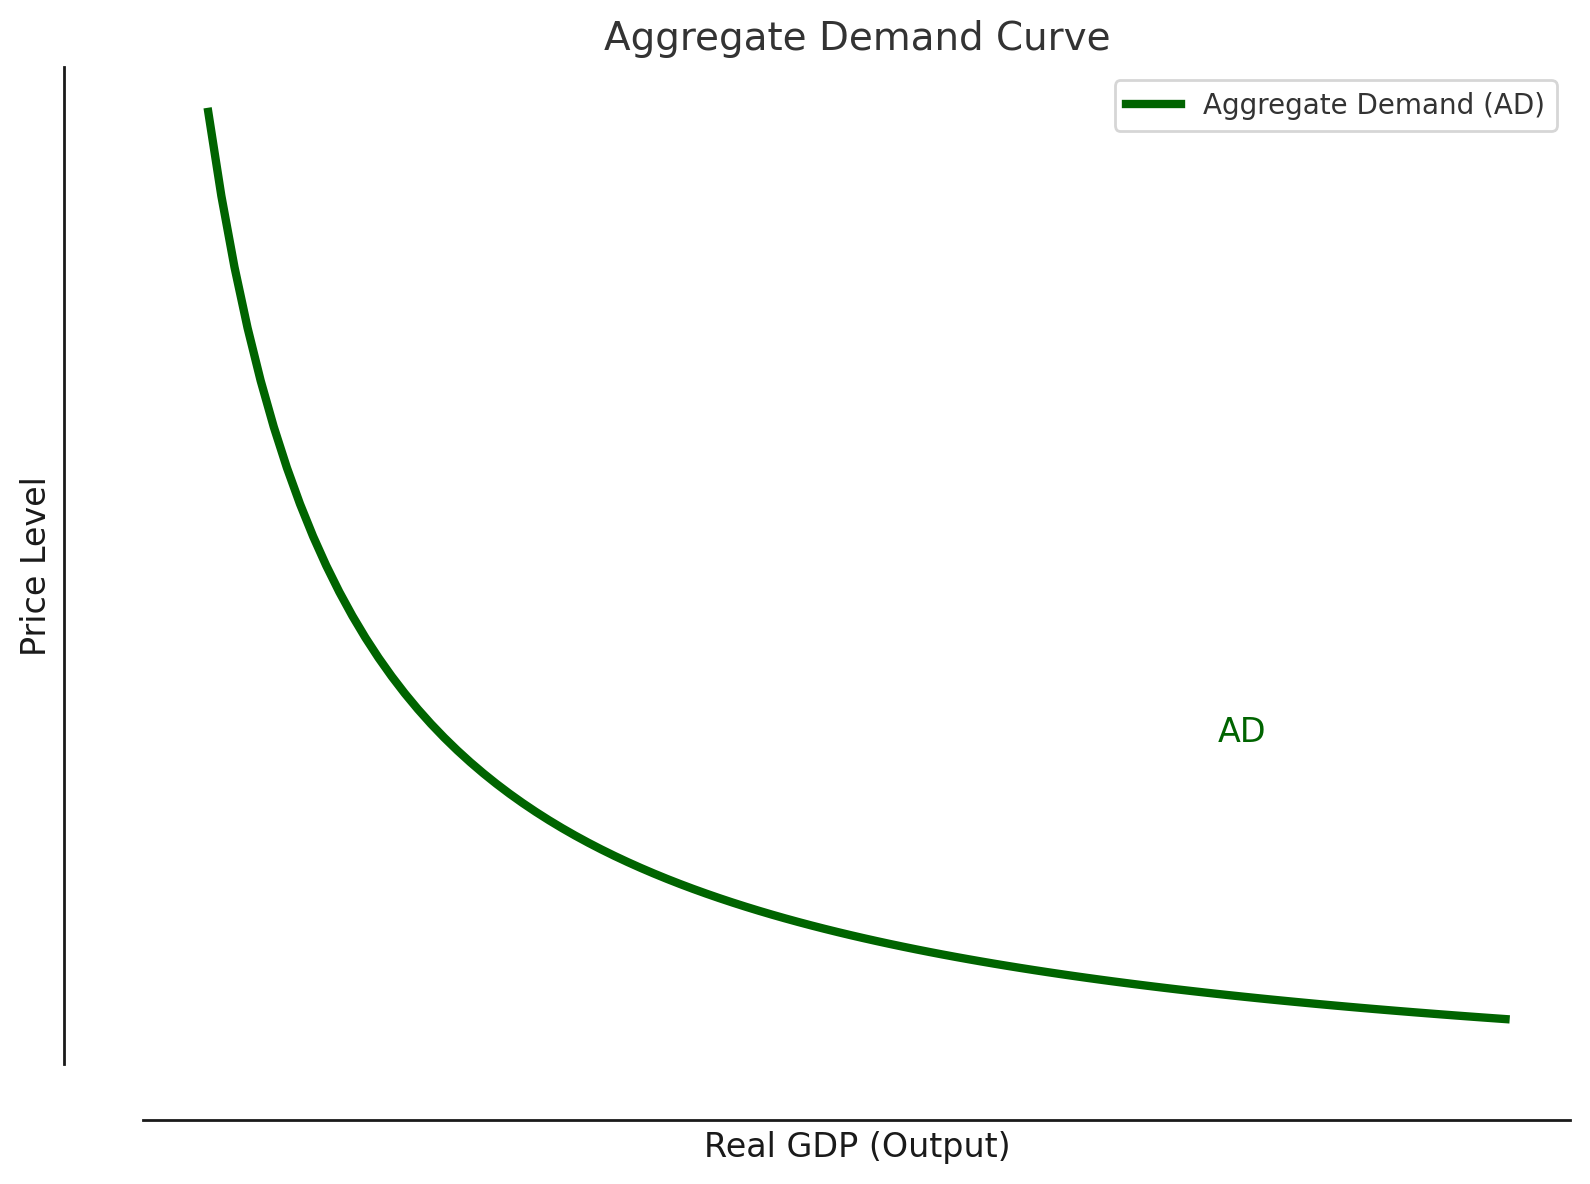
The AD curve slopes downward - when the price level rises, total spending falls. Here's why:
Higher prices make people feel poorer, so they spend less. This is called the wealth effect.
Engagement Message
If gas prices doubled tomorrow, would you drive more or less?
There's also the interest rate effect. When prices rise, people need more money for purchases, driving up interest rates.
Higher interest rates make borrowing expensive, so businesses invest less and consumers buy fewer big-ticket items.
Engagement Message
What major purchase might you delay if interest rates doubled?
The third reason is the exchange rate effect. Higher domestic prices make our exports expensive and imports cheap.
This reduces net exports (NX), lowering total spending. Three effects, one result: higher prices → lower spending.
