Understanding Generative AI Methods
Welcome to the Course 🚀
Welcome to Introduction to Generative AI. If your work involves writing queries, building dashboards, defining metrics, researching methods, or communicating findings to stakeholders, generative AI is already becoming part of your analytics workflow. In this first unit, you’ll build a plain-language mental model for what generative AI does, how it works, and where it can go wrong.
You’ll cover:
- The five major AI capabilities: text generation, image generation, image description, web search, and automation
- The three main model families: large language models, diffusion-style image models, and multimodal models
- Key limitations like context windows and hallucinations, plus why human verification matters
Start with one simple safety rule: use only approved tools, and never paste production data, customer PII, credentials, connection strings, or confidential business figures into an AI chat. Later in this lesson, you’ll turn that rule into a practical checkpoint for handling AI-assisted analytics work.
Five Capabilities, Not One Tool ⚒️
When people say "AI," they may be talking about five different capabilities, and mixing them up can lead you to use the wrong tool for the job.
| Capability | What it does | Useful for in data analysis |
|---|---|---|
| Text generation | Drafts written content | KPI readout narratives, stakeholder updates, documentation, first-draft SQL |
| Image generation | Creates pictures from a description | Readout-deck hero visuals, report section headers, QBR slides |
| Image description / vision AI | Reads a picture and describes what’s in it | Chart alt text, reading a dashboard screenshot a stakeholder sent |
| Web search | Retrieves current information from the internet | Current metric definitions, statistical-method or benchmark checks |
| Automation | Chains AI capabilities together with your other tools | Multi-step reporting or dashboard-refresh workflows |
The practical move: before you open a tool, name which capability you actually need. "I need a readout narrative" is text generation. "I need a QBR hero image" is image generation. "What's in this dashboard screenshot?" is image description. Asking the wrong tool the right question is a top reason people decide AI "doesn't work."
A scope note for this course: web search and automation are covered as capability awareness only, not hands-on skills. Treat AI "current-info" research — a metric definition, a statistical method, a benchmark — as a starting point that still requires verification against an authoritative reference, and keep a firm line between drafting support (a human runs and ships the output) and automation that writes to warehouses, refreshes dashboards, or triggers actions (which requires approval, auditability, and is out of scope here).
The Three Model Families Behind AI Tools 🧑🧑🧒
Three model families sit underneath those capabilities, and a rough mental picture of each will save you a lot of guesswork.
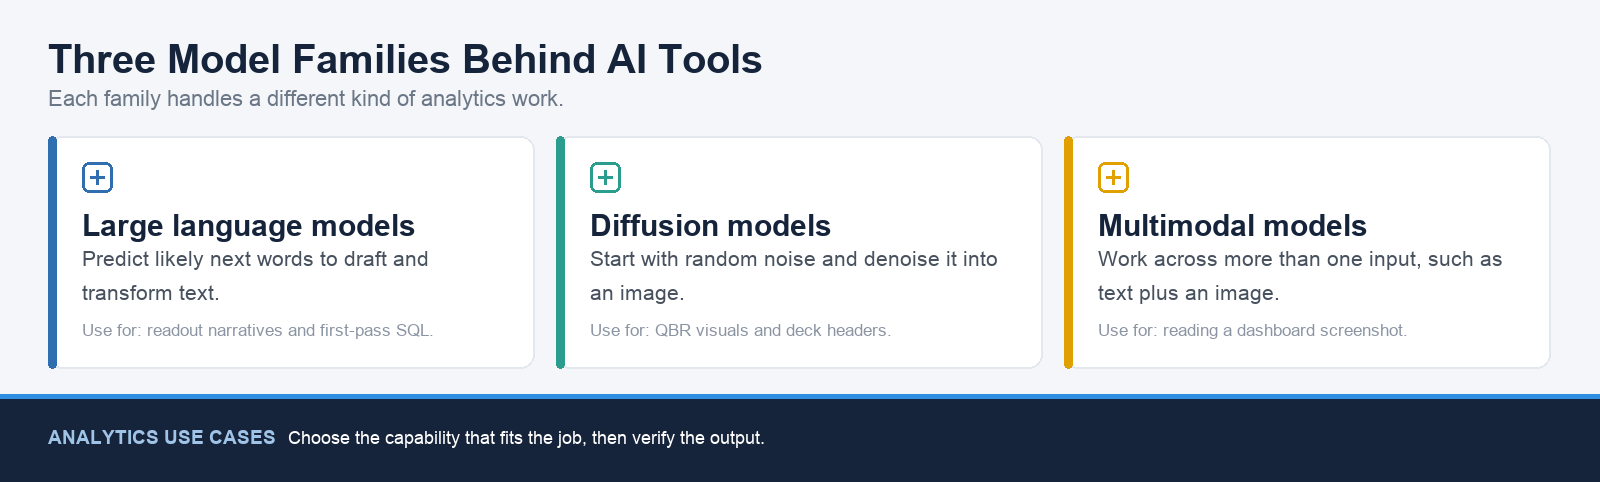
Large language models (LLMs) power text generation. Picture an extremely well-read autocomplete: given everything you've typed so far, the model predicts the most likely next word, then the next, then the next, all the way to the end of the response. It learned these patterns from massive amounts of human-written text. It doesn't "understand" your schema the way you do; it pattern-matches at a scale that feels like understanding. That's what's drafting your KPI readout narratives and your first-pass SQL.
Diffusion-style image models power image generation. Think of them as starting with a screen of static (random noise) and gradually "uncrumpling" it into a coherent picture that matches your description, one denoising pass at a time. They learned what a "clean, modern data-themed visual" looks like by training on millions of captioned images. That's what's producing your readout-deck hero visuals and QBR slides.
Multimodal models can take in more than one type of input, like text plus an image, and reason across them. That's what lets a single tool answer "what's in this dashboard screenshot?" or "turn these metric notes and a chart into a summary." Capabilities like image description and most modern chat tools live here.
What the Model Doesn't Know About Your Data 🎯
Here's the part that trips up analysts specifically. A general-purpose model has read a huge slice of the public internet, but it has never seen your actual schema, your real metric definitions, or the numbers in your warehouse. So it fills those gaps with the average of everything it has seen — and "average" has nothing to do with your data. There are three things you almost always have to supply, then verify:
- Your actual schema and metric definitions. Left alone, the model invents plausible table and column names — a
revenue_recognizedcolumn that doesn't exist — or a metric definition that contradicts yours. Any SQL or metric it drafts has to be checked against the real schema and re-run before you trust a single row. - Your real numbers. Asked for a figure, the model may invent a plausible one ("23% month-over-month lift," "record-high signups") instead of recognizing missing information or asking for it. Any number that reaches a dashboard or a stakeholder must come from you and trace back to a query against the warehouse.
- What the data can actually support. The model doesn't know which movements are real and which are pipeline artifacts, or what caused a trend. It may assert a cause or a quarter-over-quarter comparison with nothing behind it. Causation and claims are your responsibility, never the model's.
Keep these three gaps in mind — they're the reason the next section matters so much for analytics work.
Why Hallucinations Happen ⚠️
Because LLMs predict the next likely word, they will happily produce a confident, well-formed sentence even when the underlying claim is false. That’s called a hallucination: an output that sounds factual but is unsupported, inaccurate, or invented.
A hallucination might be a fake statistic ("signups up 23% month over month"), an invented column or table, a made-up cause for a movement, or a confident comparison to a quarter you never mentioned. The model is not "lying" on purpose; it is generating a plausible pattern. That’s why hallucinations are not a bug you can fully prompt your way out of; they’re a property of how the model works.
Context Windows Have Limits, Not Zero Memory 🪟
A context window is the information a model can "see" in the current conversation, including your prompt, pasted bullets or schema, and prior responses. When earlier material falls outside that window, the model may not use it in its next response. Some AI tools can also retain product-level memory or retrieve information from outside the conversation, but those capabilities depend on the tool and its settings. They are not a substitute for providing the context your task needs.
Because the model is optimizing for plausible-sounding output, the most dangerous hallucinations are the polished ones: growth percentages, "record highs," causes, and comparisons that look exactly right in a readout, a stakeholder update, or a dashboard annotation.
Here’s what that looks like in a normal analytics task. Nina used an AI tool to draft a short KPI readout blurb from a few bullet points for a weekly metrics update, but the draft included a specific growth percentage she didn’t recognize. She asks Meredith, a senior analyst with more experience reviewing AI output, what to do with it.
- Nina: I gave it three bullets on weekly active users and it handed me this clean line about a 23% month-over-month lift. Looked totally real.
- Meredith: Did the bullets you fed it include a prior-month number or a percentage?
- Nina: No, I just gave it this week's count and said it was up.
- Meredith: Then the model filled the gap with whatever sounded plausible. That's a hallucination, not a fact.
- Nina: So I need to verify anything it added that I didn't give it?
- Meredith: Exactly. If you didn't put it in, treat it as a claim to check against the query, not a number to publish.
Notice the move: Meredith didn't argue with the output, she traced it back to what was in the prompt versus what the model invented.
In most jobs, a hallucination is an embarrassing mistake. In analytics, a polished one can become a reported, decision-driving number that isn't real. A fabricated growth rate, an invented column, a made-up cause, or an unearned "record high" isn't just wrong — it can send a stakeholder down the wrong path and chip away at the trust people place in your numbers. That's why the verification bar is higher here than in general office work: every figure and trend gets reconciled against the source data before it ships, informs a decision, or reaches a stakeholder.
Data Analyst AI Safety Checkpoint 🛡️
Before any AI-assisted analysis task, check the following:
- Approved tools only: Use a tool your organization has explicitly approved for the data and task.
- Minimize data: Use sample, synthetic, or de-identified data. Never paste production data, customer PII, credentials, connection strings, or confidential business figures.
- Verify sources: Treat AI-written SQL, statistics, and "facts" as unverified until you validate them against the real schema and data, then re-run the query when relevant.
- Keep human review: A person confirms every number before it informs a decision, appears in a dashboard, or reaches a stakeholder.
- Escalate sensitive work: Route regulated, PII, or financial-reporting data to the appropriate data owner.
- Keep records in approved systems: Your warehouse, BI tool, and versioned query repository are systems of record. AI chats are not.
The single most important takeaway from this unit: generative AI doesn't retrieve truth, it generates plausible patterns, so your value as the analyst in the loop is to pick the right capability, supply what the model can't know (your real schema, your real numbers, what the data can support), and verify what came out before anything reaches an analysis, a dashboard, or a stakeholder.
Everything above is theory until you have to explain it to someone else in plain English. Your next step is a live roleplay where a curious teammate asks you how this stuff actually works: your job is to make the three model families stick using everyday analogies, no jargon allowed.
