Welcome to Inside the Parabola: a, b, and c! This is the first lesson of the course, and we begin with a familiar shape seen from a new angle. Every satellite dish, every arc of water from a hose, and every path of a tossed ball traces the same curve, and in algebra that curve is controlled by just three numbers.
A quadratic function written in standard form looks like this:
y=ax2+bx+c
Three numbers, three jobs. In this lesson we focus on two of them, a and c, because each one has a clear and predictable effect on the graph. By the end, you will be able to look at a quadratic and describe its opening direction, its relative width, and where it crosses the y-axis, all without plotting a single point.
The Parabola We Already Know
Our reference curve is y=x2. It opens upward, its lowest point (the vertex) sits at the origin (0,0), and it is symmetric about the y-axis. Two reference points make it easy to sketch by hand: from the vertex, moving 1 unit right or left raises the curve by 1, and moving 2 units right or left raises it by 4.
Everything in this lesson is a transformation of that single curve. Writing y=ax2+c means taking y=x2, scaling its outputs by a, then shifting the result by c. The transformation rules are ones you have already used; what is new is attaching them to the letters that appear in standard form.
What a Does: Orientation
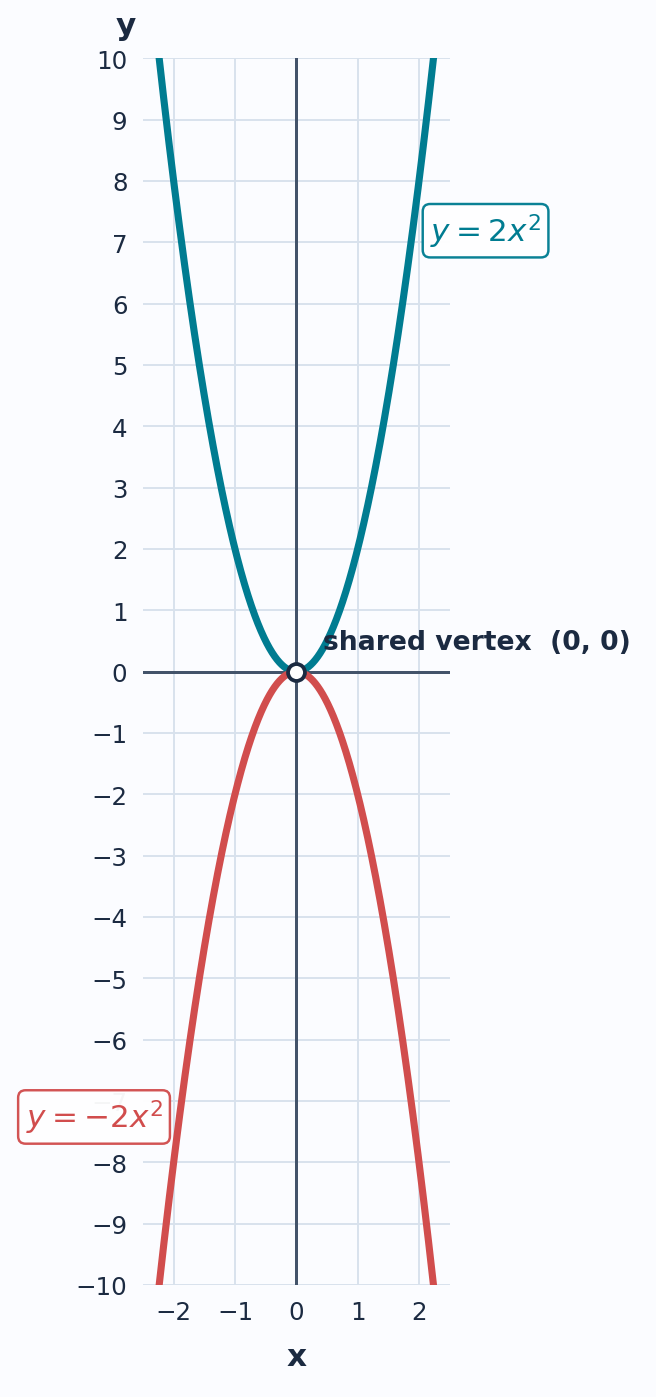
The coefficient a multiplies the output of x2, so it plays exactly the role that output scaling played before. Since x2 is never negative, the sign of a alone decides which way the arms of the parabola point.
If a>0, the parabola opens upward and the vertex is the lowest point.
If a<0, the parabola opens downward and the vertex is the highest point.
Compare y=2x2 and y=−2x2 at x=3: the first gives y=18, the second gives y=−18. Every output flips sign, which is precisely a reflection across the x-axis. One restriction is worth noting: a cannot be 0, because then the x2 term would vanish and we would be left with a line rather than a parabola.
Join the 1M+ learners on CodeSignal
Be a part of our community of 1M+ users who develop and demonstrate their skills on CodeSignal
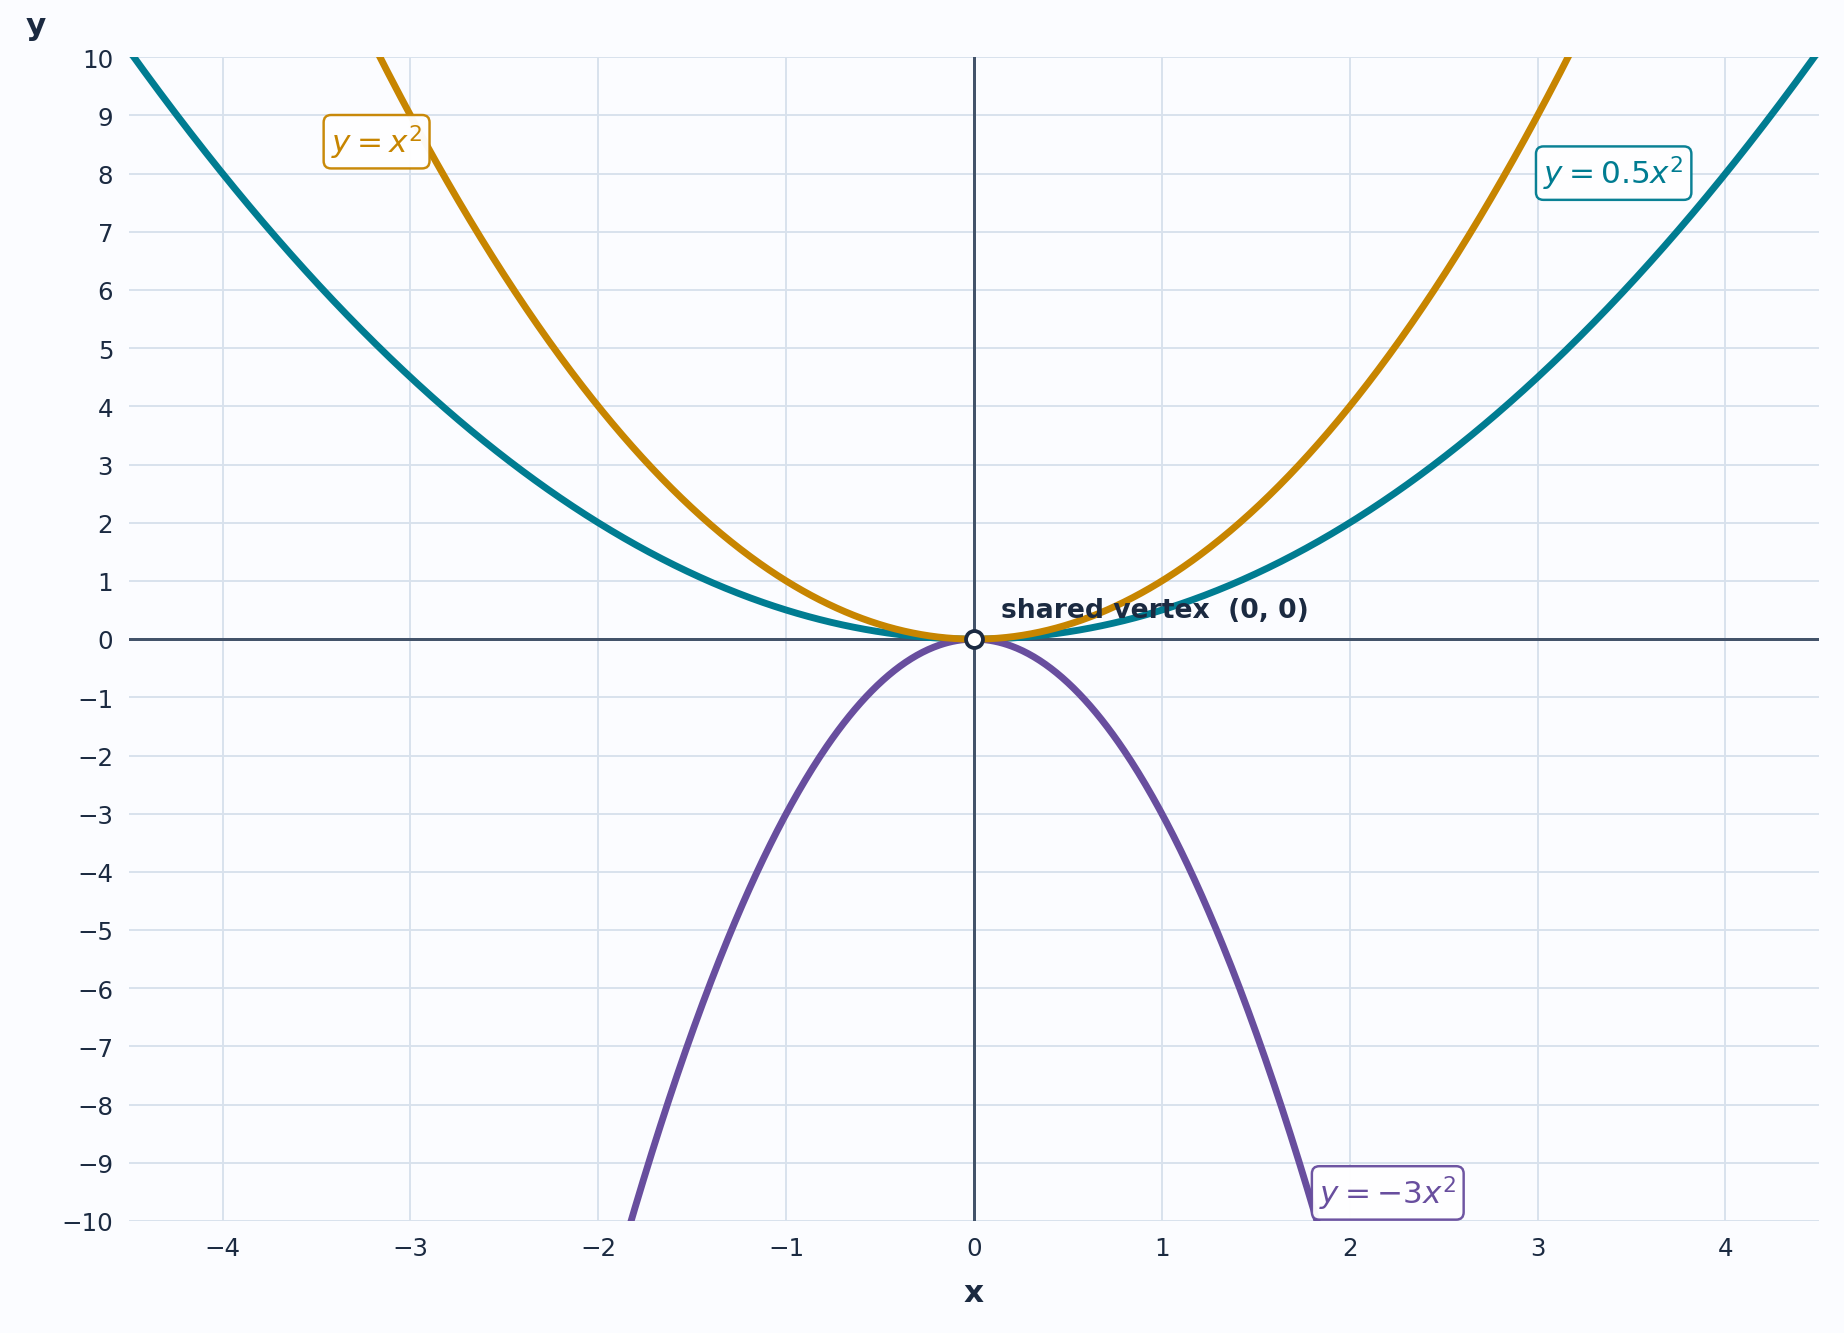
The size of a, ignoring its sign, controls how quickly the curve climbs or falls away from the vertex. Multiplying outputs by a large number stretches the curve vertically, which makes it look narrow; multiplying by a small fraction compresses it, which makes it look wide.
Value of a
Effect compared to y=x2
Appearance
∣a∣>1
Outputs stretched away from the x-axis
Narrower
∣a∣=1
Same outputs (up to a flip)
Same width
0<∣a∣<1
Outputs compressed toward the x-axis
Wider
The key habit is to judge width by magnitude only. The parabolas y=4x2 and y=−4x2 are mirror images, yet they are equally narrow. So to order y=0.5x2, y=−3x2, and y=x2 from widest to narrowest, we compare the magnitudes 0.5<1<3 and read off: y=0.5x2, then y=x2, then y=−3x2.
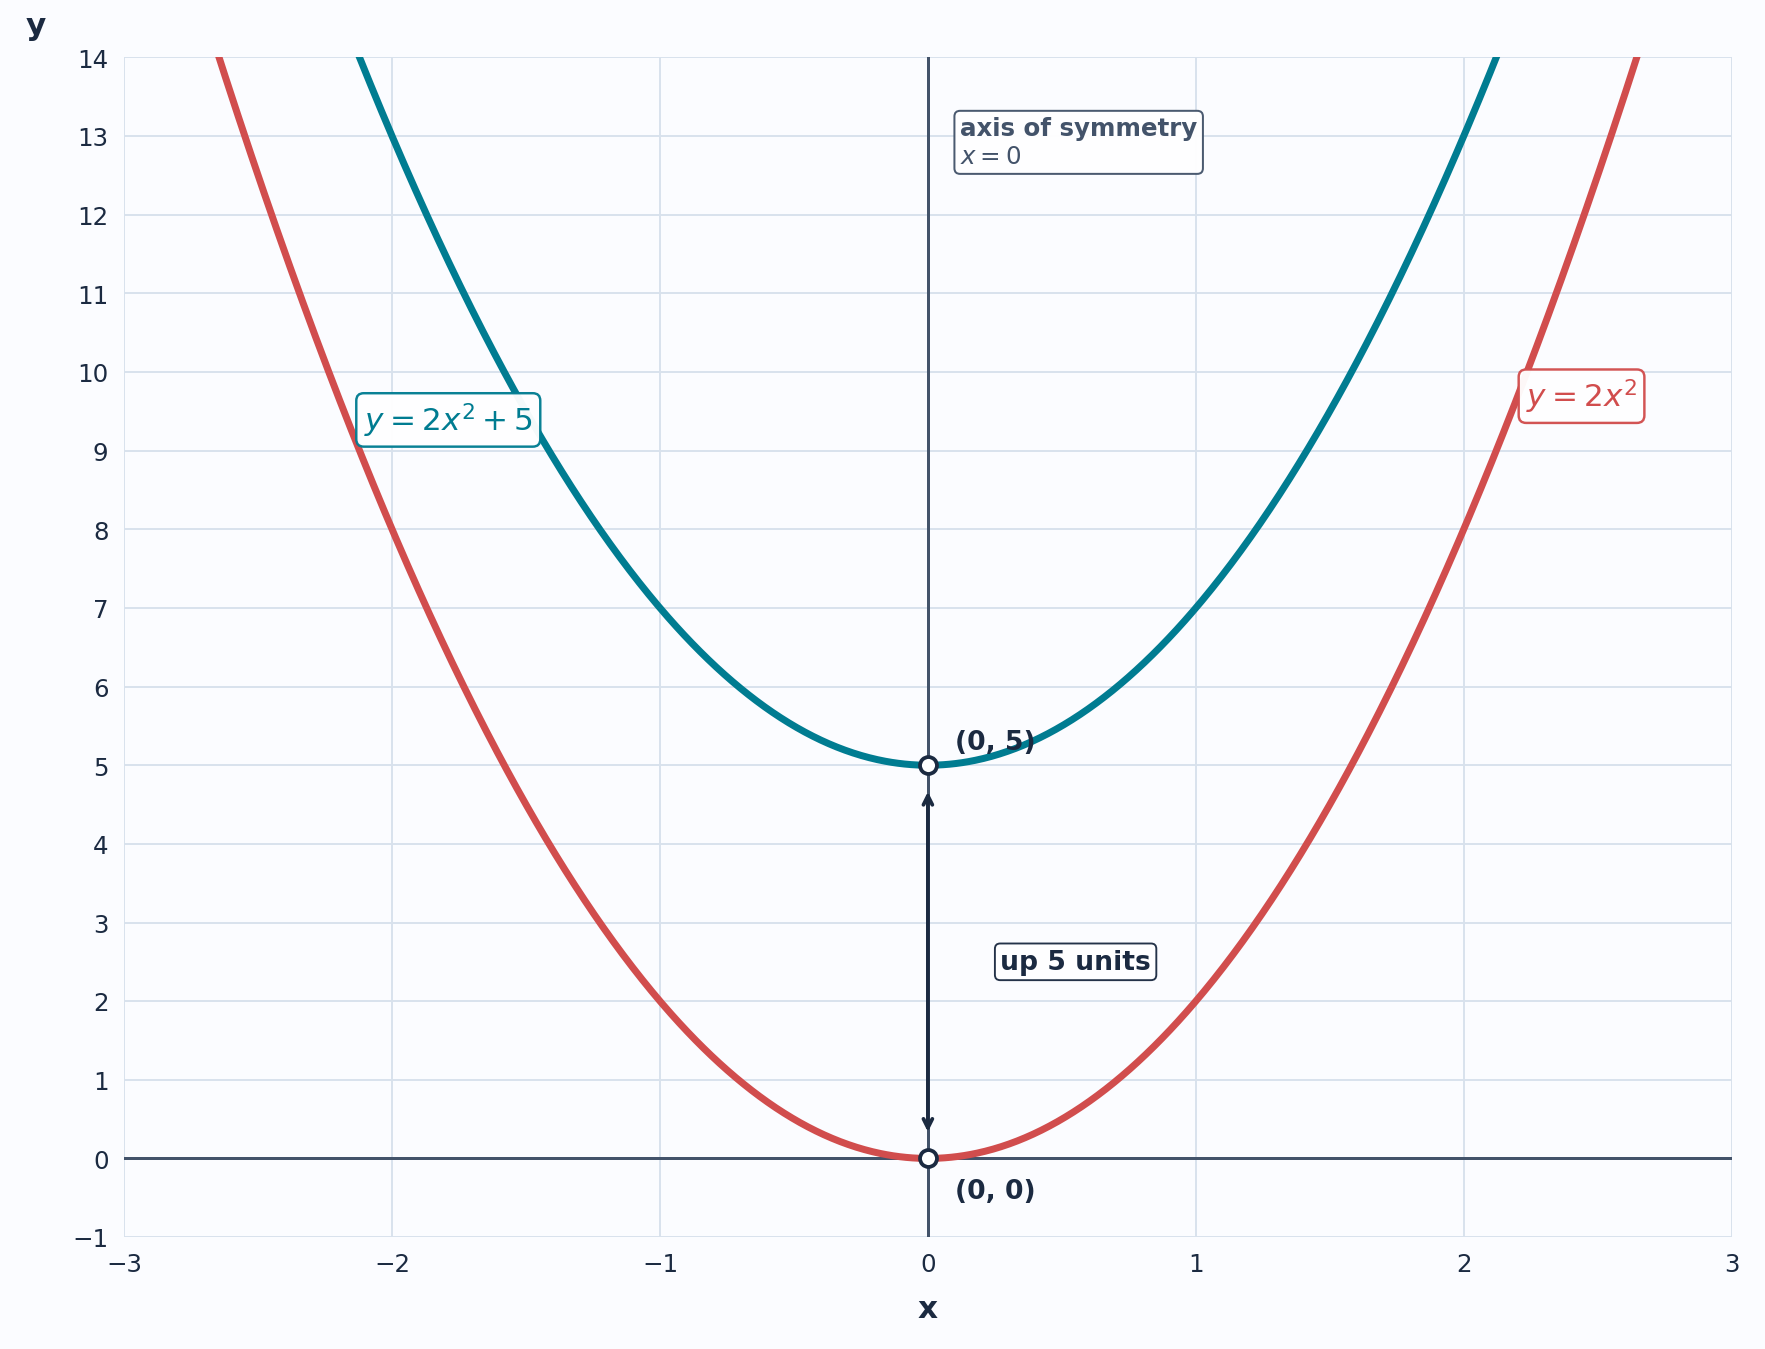
Now hold a fixed and turn to c. In y=ax2+bx+c, the constant c is added after everything else has been computed, so it is an outside change: it shifts the entire graph up by c units, exactly like the f(x)+k rule. A negative c shifts the graph down by the same reasoning.
Because this shift is rigid, it relocates the curve without reshaping it. Going from y=2x2 to y=2x2+5:
The vertex moves from (0,0) to (0,5).
The opening direction stays upward, since a did not change.
The width stays the same, since ∣a∣ did not change.
The axis of symmetry stays x=0, since nothing moved left or right.
There is a second, very handy way to think about c. The y-intercept of any graph is its height at x=0, so let us substitute x=0 into the standard form:
y=a(0)2+b(0)+c=0+0+c=c
The first two terms disappear because both contain a factor of x. So for any quadratic in standard form, the y-intercept is (0,c), regardless of a and b. For y=−3x2+7x−2, the curve crosses the y-axis at (0,−2), with nothing left to compute.
One caution keeps this from turning into a trap: c is always the y-intercept, but it is the vertex height only when b=0, because only then does the vertex sit on the y-axis.
Let us read one equation completely: y=−0.5x2+3. The coefficient a=−0.5 is negative, so the parabola opens downward, and since ∣−0.5∣<1, it is wider than y=x2. There is no x term, so b=0, the axis of symmetry is x=0, and the vertex sits on the y-axis at (0,3), which is also the y-intercept.
This kind of reading shows up in real models. A sprinkler arc might be described by y=−0.2x2+1.5, where y is height in meters and x is horizontal distance from the nozzle. The negative a says the water arcs downward, its magnitude says how sharply the spray falls off, and c=1.5 says the nozzle sits 1.5 meters off the ground.
Now raise the sprinkler to 2 meters. Only c changes, giving y=−0.2x2+2: the arc keeps its shape and spread, its peak stays directly above the nozzle, and the whole stream simply rides half a meter higher.
Two of the three coefficients are now under control. The sign of a sets the opening direction, the magnitude of a sets the width relative to y=x2, and c lifts or lowers the whole curve while leaving orientation, width, and axis of symmetry untouched. We also derived, rather than memorized, the fact that the y-intercept of a standard-form quadratic is (0,c).
The missing piece is b, the coefficient that affects the axis of symmetry and vertex location, and we will meet it in the next lesson. First, let's put a and c to work in the practice exercises ahead, where you will match coefficients to curves, order parabolas by width, and raise a sprinkler of your own.