Every organization has access to a flood of data—page views, downloads, signups, and more. But not all data points are metrics worth managing to. Data is just raw information; metrics are the specific numbers you choose to measure progress toward your goals. The distinction is crucial: you can’t control what data is generated, but you must be intentional about which metrics you select and manage.
For example, imagine a nonprofit launches a video campaign that racks up 1.5 million views. On the surface, this looks like a huge win. But if the real goal is to drive donations and only a handful of viewers actually donate, the campaign is a failure by the metric that matters. This highlights the danger of confusing impressive data with meaningful metrics.
Selecting the right metrics is a pivotal skill for any analytics-savvy manager. The numbers you choose to track will shape your team’s focus, influence decisions, and ultimately determine whether your efforts drive real business value. In this unit, you’ll use concepts from the HBR Guide to Data Analytics Basics for Managers to learn how to distinguish between metrics that simply look impressive and those that truly matter for your organization’s goals.
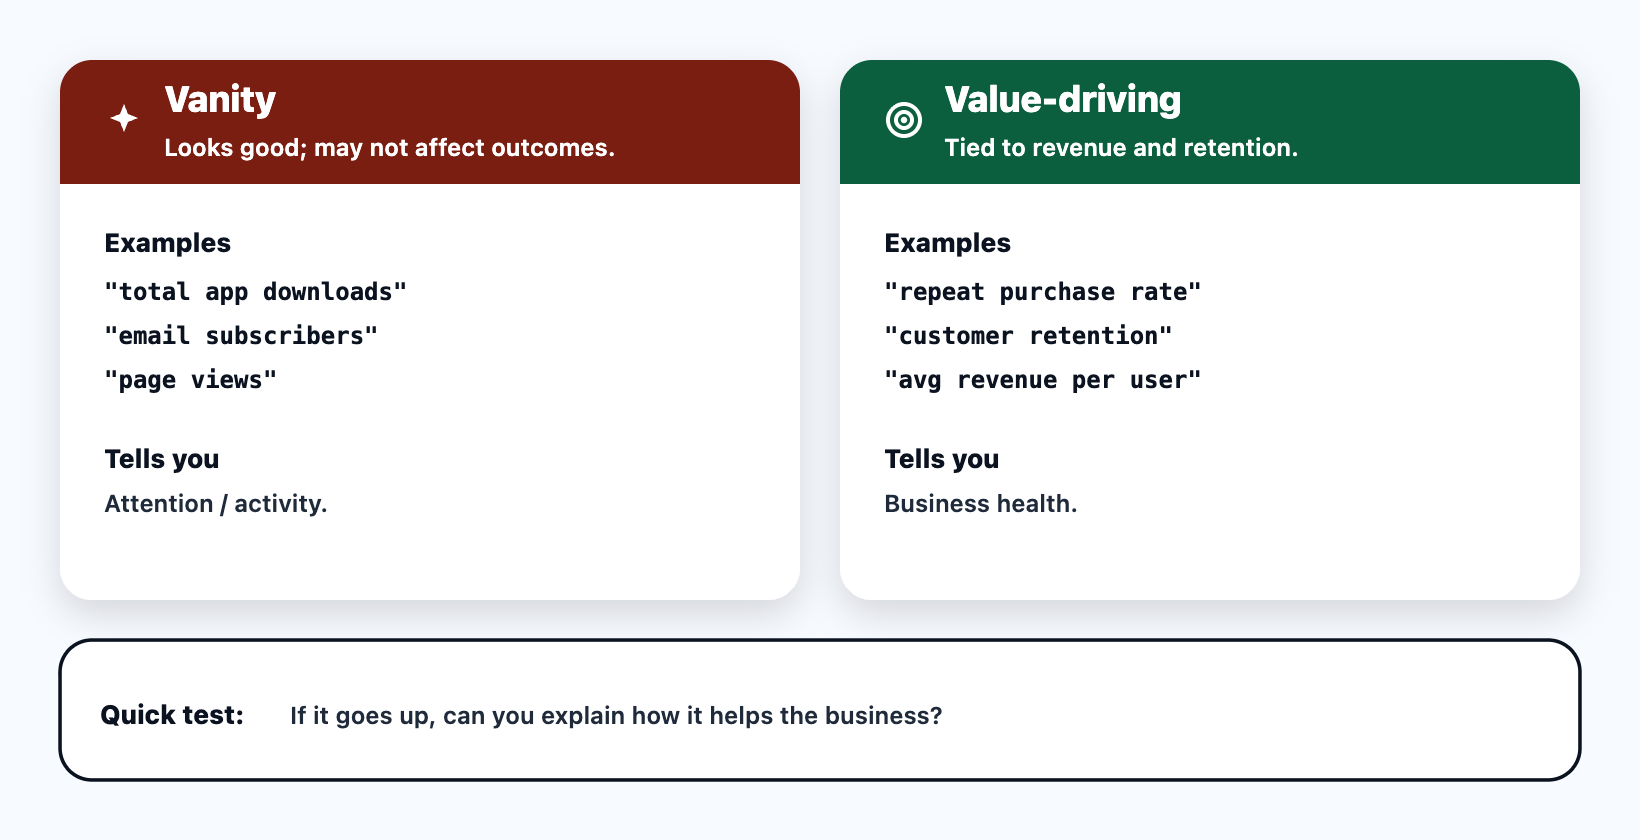
It’s easy to be drawn to numbers that grow quickly or look good in presentations—these are known as vanity metrics. Examples include "total app downloads" or "number of email subscribers". While these figures can be eye-catching, they often fail to reflect meaningful progress. For instance, a spike in "page views" might not translate to more purchases or loyal customers.
In contrast, value-driving metrics are directly linked to the outcomes your business cares about. These might include "repeat purchase rate", "customer retention", or "average revenue per user". A simple way to test a metric’s value: if it increases, can you clearly explain how it benefits the business? If not, it’s likely a vanity metric. For example, "number of demo requests" only matters if those requests actually lead to sales.
When organizations choose the wrong metrics, they risk encouraging the wrong behaviors and missing their true goals. What you measure is what your team will focus on. If you track YouTube views, your team will optimize for more views—even if that doesn’t help your real objective. In baseball, for example, teams that only tracked batting average missed out on players who contributed in other, more valuable ways.
To ensure your metrics are meaningful, start by clarifying the behavior or outcome you want to influence. If your goal is to boost customer loyalty, tracking "monthly active users" is less useful than measuring "percentage of users who return within 30 days".
A practical approach to choosing metrics is to identify a target objective up front and work around it:
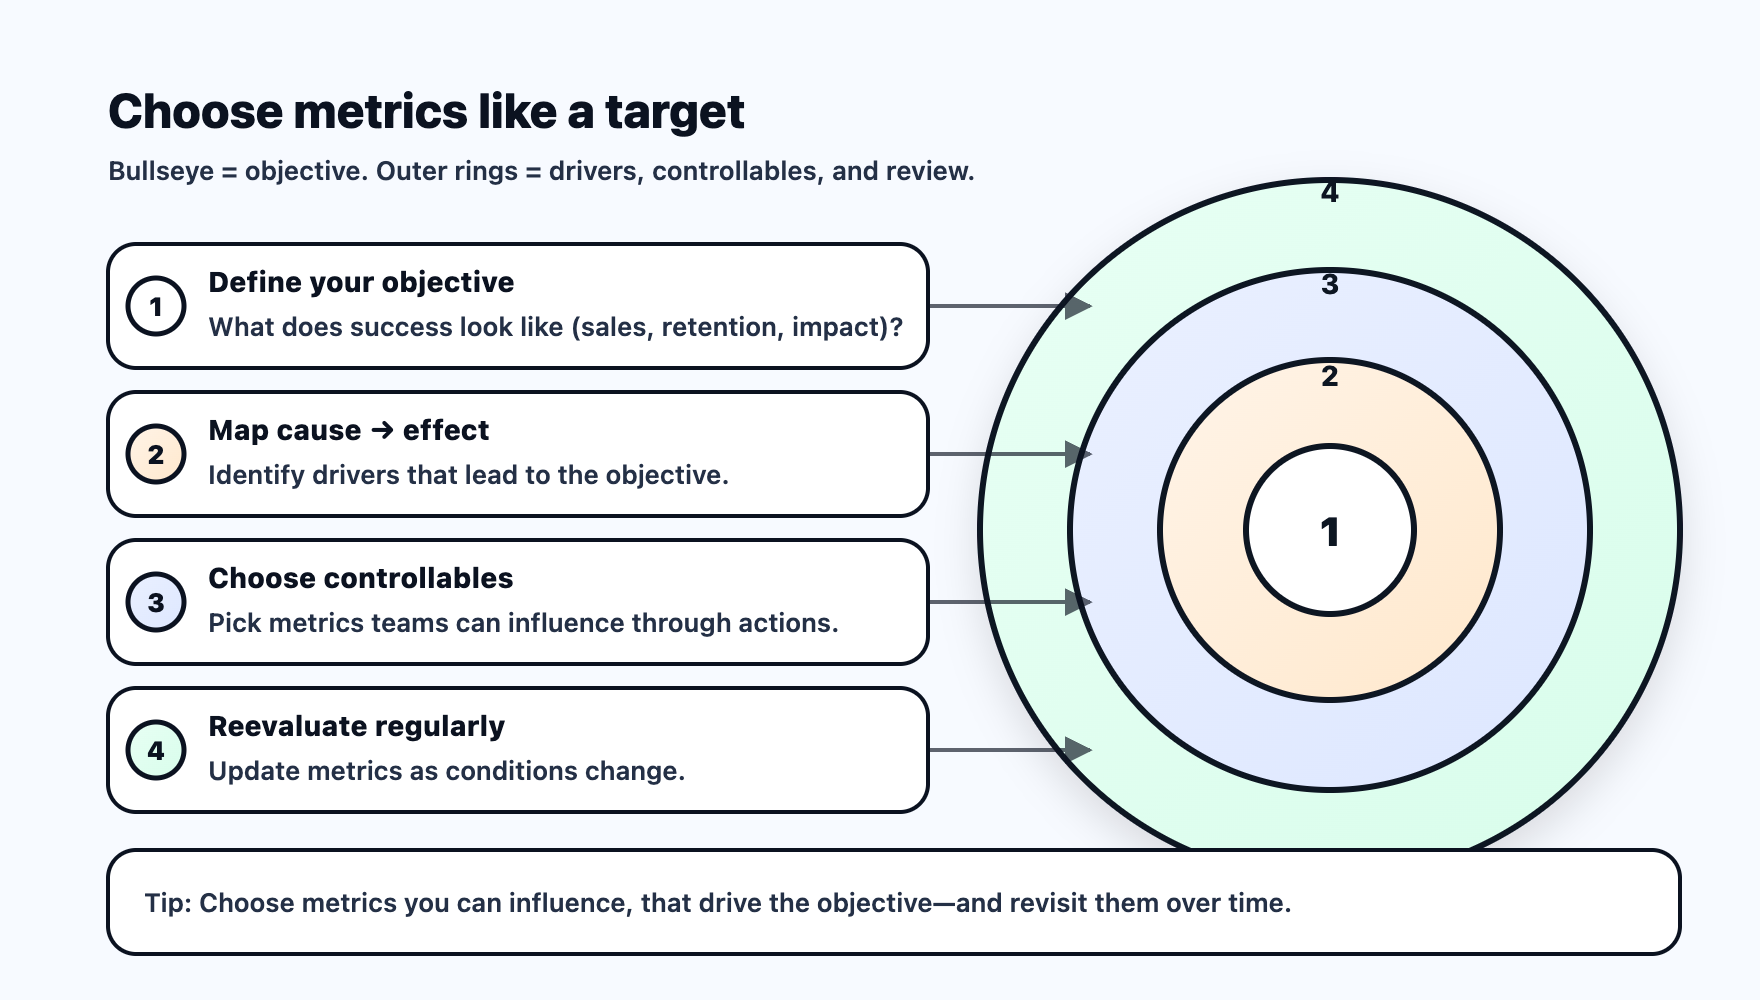
- Define Your Objective: Be clear about what success looks like for your organization—whether it’s sales growth, customer retention, or social impact.
- Develop a Theory of Cause and Effect: Identify what drives your objective. For example, if customer satisfaction leads to higher retention, then satisfaction is a key metric.
- Identify Controllables: Choose metrics that employees can influence through their actions, such as response time or product quality.
- Regularly Reevaluate: As your business and environment change, revisit your metrics to ensure they still align with your objectives and reflect what truly matters.
It’s also important to balance leading indicators (which predict future results, like "number of new trial signups") with lagging indicators (which confirm what’s already happened, such as "quarterly revenue"). This combination helps you spot trends early and validate your progress over time.
Effective metrics are actionable, easy to understand, and clearly connected to business goals. The following conversation example shows how you can redirect attention from surface-level numbers to metrics that truly reflect business impact. Notice how clarifying questions and a focus on outcomes help shift the team’s mindset
