Summarizing With Lines
Introduction
Welcome back to Fitting a Line to Data! In the previous lesson, you learned how to assign explanatory and response roles to your variables and place them on the correct axes. Now, in this second lesson, we move to the central idea of the course: drawing a straight line through a scatter plot to capture the overall trend in the data.
A scatter plot can contain dozens or even hundreds of points, but a well-chosen line boils all of that information down to a single, easy-to-read summary. In this lesson, you will explore what it means for a line to summarize a relationship, why that line does not need to touch every data point, and how to judge by eye whether a proposed line does a reasonable job.
From Points to a Pattern
Think about a scatter plot you might see at work. Perhaps it shows the years of experience employees have on the -axis and their annual salary on the -axis. The points will not form a perfectly neat row. Some people with the same experience earn more; others earn less. There is natural scatter in the data.
Yet when you step back and look at the whole cloud of points, you often notice a general direction: as experience goes up, salary tends to go up too. That overall direction is the trend. Our goal is to capture it with a single straight line that acts like a summary sentence for the entire scatter plot — it tells you roughly where the data are headed without repeating every individual detail.
This is the same idea behind any good summary. A one-sentence book review does not retell every chapter; it captures the main message. A trend line does the same thing for a scatter plot.
The Line Does Not Pass Through Every Point
This idea surprises many learners at first. A good summary line runs through the middle of the point cloud, balancing the points that fall above it with those that fall below. It is not meant to connect the dots.
Why not? Because the individual points contain variability — random differences caused by factors we are not measuring. In the salary example, two employees with equal experience might earn different amounts because of differences in industry, negotiation, or location. A line that zigzagged through every single point would be capturing that noise rather than the underlying pattern. A straight line smooths over the noise and highlights only the broad, repeatable trend.
In data science, we often call this distinction signal vs. noise. The line represents the signal—the underlying, reliable relationship between the two variables. The "noise" consists of all the factors we aren't measuring, such as individual differences, luck, or measurement errors. By drawing a line that ignores the noise and captures the signal, we gain a tool that is much more useful for understanding the big picture and making predictions for new data.
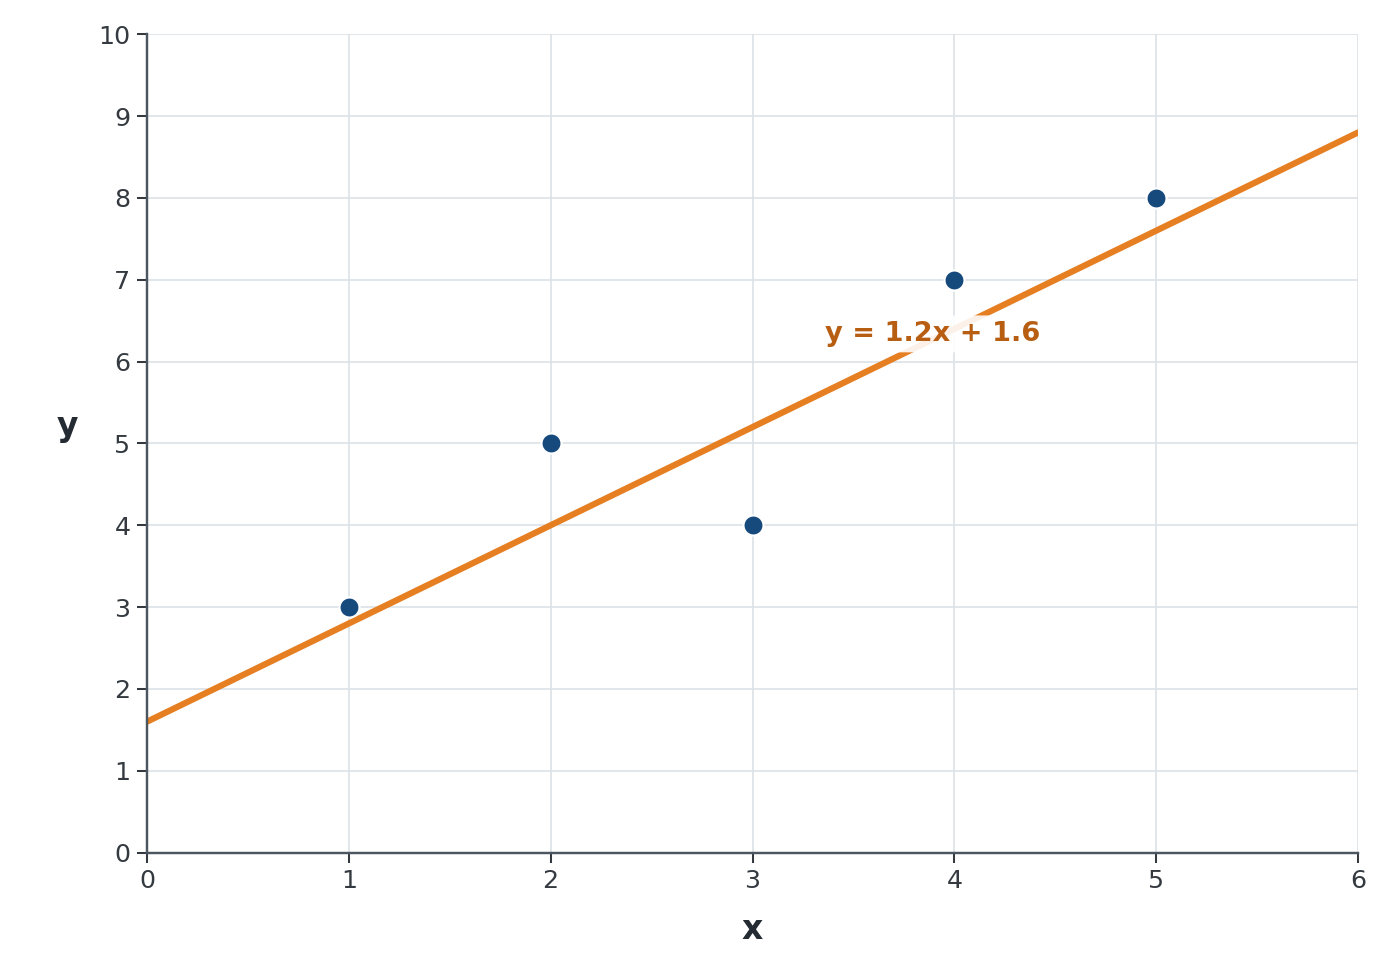
Consider a simple example with five data points:
| 1 | 3 |
| 2 | 5 |
| 3 | 4 |
| 4 | 7 |
| 5 | 8 |
If you plot these points, no single straight line will hit all five. But a line like passes through the middle of the cloud, staying close to most points even though it misses each one by a little. That small trade-off is exactly what a summary is supposed to do: sacrifice perfect accuracy at any single point in exchange for a clear picture of the overall relationship.