Residuals and Prediction Error
Introduction
You can look at a scatter plot with a line through it and say "that looks like a decent fit" — but how much would you trust that judgment? So far in Fitting a Line to Data, you have placed variables on the right axes, drawn a summary line through a cloud of points, and checked the fit with your eyes. Now, in this third lesson, we introduce a precise measuring tool that removes the guesswork entirely.
That tool is called a residual. A residual puts an exact number on the gap between what a line predicts and what the data actually show. By the end of this lesson, you will be able to compute a residual for any data point and read its sign to know instantly whether the point sits above or below the line.
From Eyeballing to Measuring
In the previous lesson, you judged a summary line by checking its direction, balance, and closeness to the data cloud. Those visual checks are a great starting point, but they are inherently subjective. Two people looking at the same plot might disagree about which of two lines fits better, because "close enough" means different things to different eyes.
Residuals solve that problem. Instead of saying "that point looks a little above the line," you can say the point is exactly 1.4 units above. This shift from visual impression to exact measurement is what turns line fitting from an art into a tool we can reason with and compare objectively.
What Is a Residual?
A residual is the vertical difference between an observed data value and the value the line predicts for the same -coordinate. To write this as a formula, statisticians use the symbol (pronounced "y-hat") to represent the predicted value.
The formula for a residual is:
The observed value () is the actual -coordinate of the data point — the number that appears in your data set. The predicted value () is the -value you get when you plug that point's -coordinate into the equation of the line. Notice the word vertical: we always measure the gap straight up or straight down, parallel to the -axis, never at an angle.
Pro-Tip: To remember the order of subtraction, think of the alphabet: O comes before P. It’s always Observed () minus Predicted ().
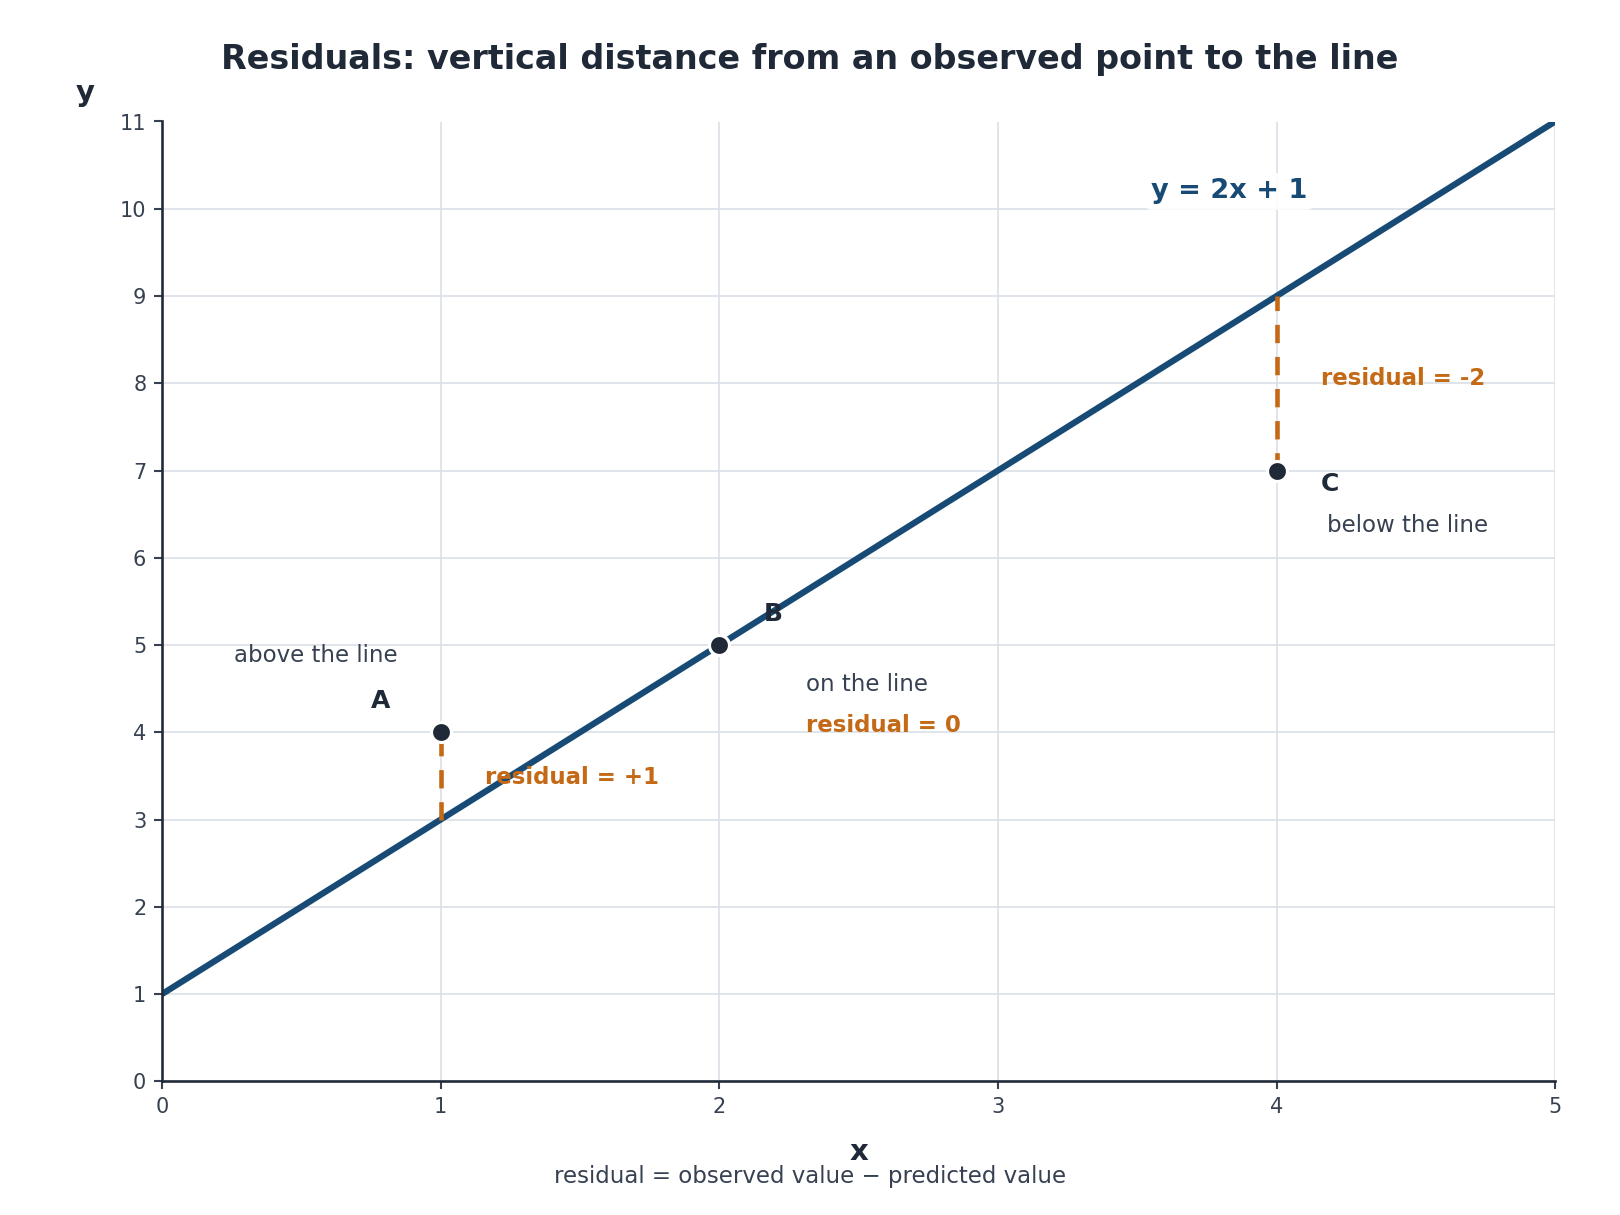
Why subtract in this order? Because the sign of the result tells you which side of the line the point falls on. If the observed value is larger than the prediction, the residual is positive and the point sits above the line. If the observed value is smaller, the residual is negative and the point sits below.
