Summarizing Boolean Masks
Introduction
Welcome back to Filtering and Replacing with Masks and np.where. We’re on lesson 3 of 4, and we’re taking the Boolean masks we’ve learned to build and turning them into useful summaries. We’ll use bus delays to answer three questions: how many days each route was late, how many routes were late each day, and what fraction of days each route was late. The key is to summarize the same mask in different ways.
True Counts as 1
As you may recall from earlier units, a comparison such as delays > 10 creates a Boolean mask with the same shape as the table. Its entries are True where the condition matches and False where it does not. NumPy treats True as 1 and False as 0 when adding Boolean values. So, summing a mask counts how many matches there are. We can then choose an axis to decide which groups to count.
Counting per Column with sum(axis=0)
Our table has one row for each day and one column for each route. The condition delays > 10 marks delays greater than 10 minutes as late. We can sum the mask down its rows with axis=0, leaving one count for each route. This uses the axis rule from an earlier course: the axis we pass is the one that gets collapsed.
The print call counts True values in each column:
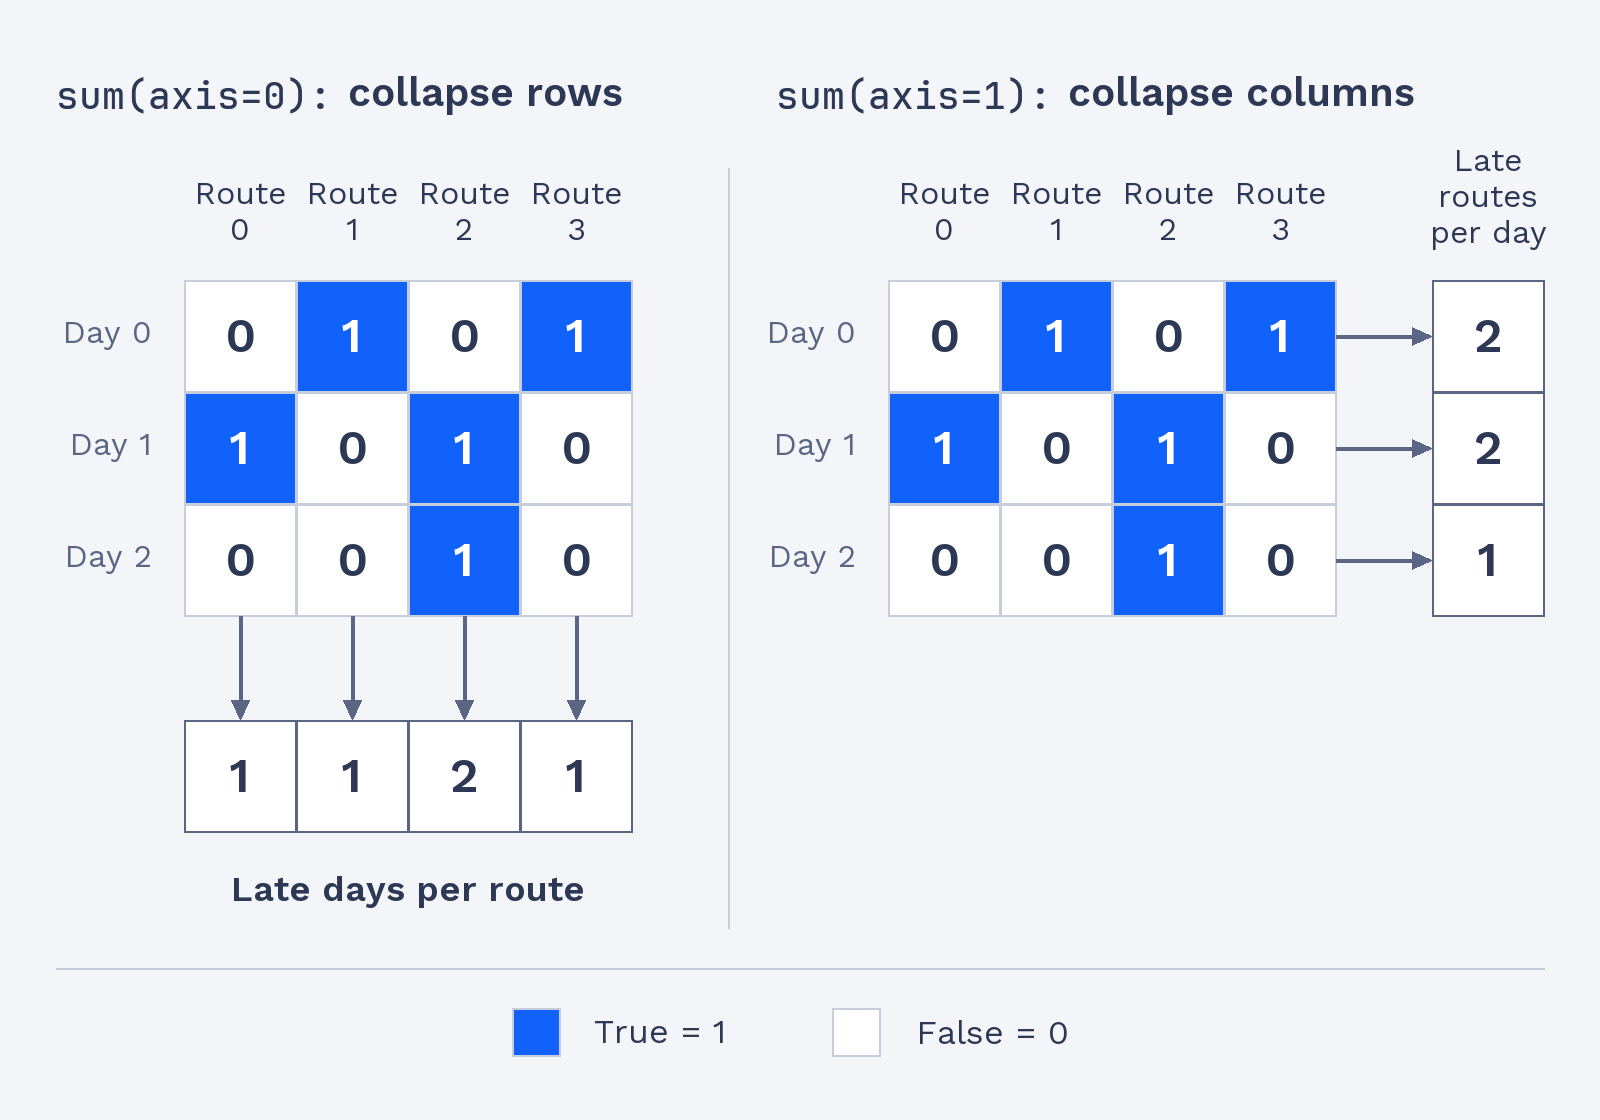
In route order, the counts mean route 0 was late on 1 day, route 1 on 1 day, route 2 on 2 days, and route 3 on 1 day. The result has four values because the table has four route columns.
Counting per Row with sum(axis=1)
Now we can ask a different question without changing the table or mask: how many routes were late on each day? Summing with axis=1 collapses the columns, leaving one count per row. In other words, axis=0 leaves route counts, while axis=1 leaves day counts.
This time, the output contains three values, one for each day:
The first day had 2 late routes, the second also had 2, and the third had 1. Notice that the result’s length matches the number of rows, unlike the four-value per-route result. To choose the axis, first decide whether each answer should describe a row or a column.
The same mask below shows how collapsing rows or columns leaves different groups of counts.