Welcome to the first lesson of our Feature Engineering and Problem Handling course! Before we dive into sophisticated feature engineering techniques, it's crucial to understand why our baseline models might be underperforming. One of the most common reasons for poor model performance is the presence of features that do not have a strong relationship with the target variable.
In this lesson, you'll learn how to diagnose a common issue that can weaken your models: weak correlations with the target variable. This diagnostic is an essential first step before applying any feature engineering techniques, as it helps you identify which features may not be contributing much predictive power and could benefit from further engineering.
Our podcast dataset contains various features about podcasts, such as episode_length, host_popularity, guest_popularity, and the target variable Listening_Time_minutes, which represents how long users listened to each podcast episode. Our goal will be to predict listening time based on the available features.
By identifying features with weak correlations to the target, you'll be able to make informed decisions about which features to transform, combine, or possibly discard in later units. This diagnostic process forms the foundation for all the feature engineering work we'll do throughout the course.
To start, we want to understand how each feature relates to our target variable. Correlation is a statistical measure that indicates the extent to which two variables fluctuate together.
- A correlation coefficient of 1 indicates a perfect positive correlation (as one variable increases, the other increases).
- A correlation coefficient of -1 indicates a perfect negative correlation (as one variable increases, the other decreases).
- A correlation coefficient of 0 indicates no linear relationship between the variables.
For predictive modeling, features with strong correlations (either positive or negative) with the target variable are typically more useful than those with weak correlations. Features that have little to no correlation with the target might not contribute much predictive power to our model.
We can calculate correlations using pandas' .corr() method, which by default uses the Pearson correlation coefficient. To focus on the relationship between our features and the target variable (Listening_Time_minutes), you can use the following code:
This code calculates the correlation between each feature and the target variable, takes the absolute value (since we care about the strength of the relationship, not the direction), and sorts the results in ascending order. The .head() method shows the features with the weakest correlations.
- Values close to 0 indicate a very weak or no linear relationship with the target.
- Values closer to 1 (or -1 before taking the absolute value) indicate a strong relationship with the target.
Features with correlation values below 0.2 are generally considered to have weak relationships with the target and may benefit from feature engineering.
Note: The threshold of 0.2 is a common rule of thumb, but it is not a strict cutoff. The choice of threshold depends on the specific dataset, domain, and modeling goals. It's important to experiment with different thresholds and validate their impact on model performance, as sometimes even features with low correlation can be useful in non-linear models or after transformation.
In addition to looking at the correlation coefficients, it can be helpful to visualize the relationships between features and the target variable. For example, you can use scatter plots to see if there is any visible pattern between a feature and the target:
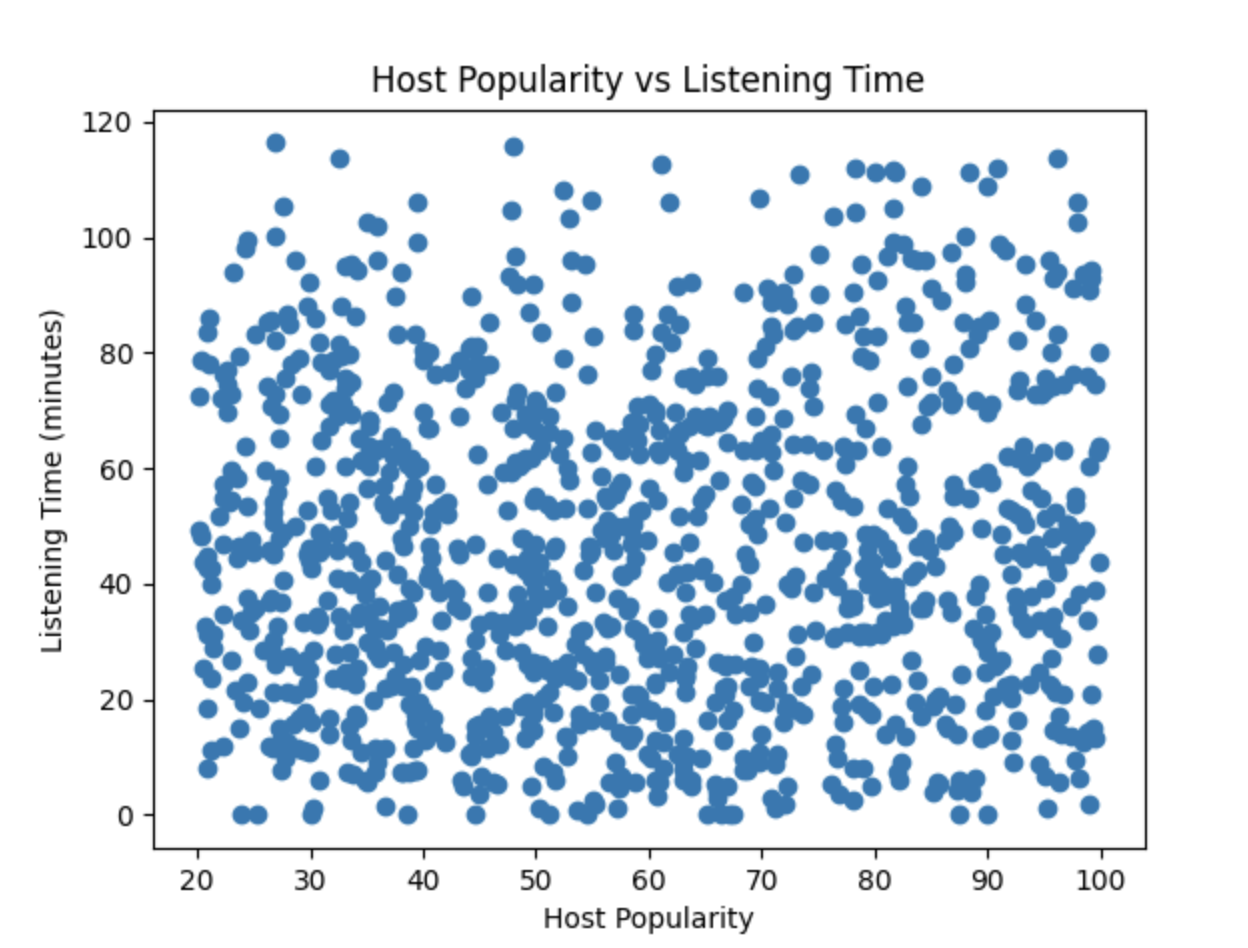 In this scatter plot, the points are widely dispersed without forming any clear pattern or trend. This visual spread indicates that there is little to no linear relationship between
 Host_Popularity_percentage and Listening_Time_minutes. The lack of a visible association supports the low correlation value observed earlier, suggesting that host popularity is not a strong predictor of listening time in this dataset.
In this lesson, you've learned how to diagnose a common issue that can weaken your baseline models: weak correlations with the target variable. This diagnostic is a crucial first step in the feature engineering process, as it helps you identify which features may need to be transformed, combined, or engineered differently to improve their predictive power.
In the upcoming lessons, we will explore how to add new features or create new ones from existing features—even those with weak correlations—and see the power of feature engineering in improving model performance.
