Mastering Statistical Computations with SciPy
Introduction and Topic Overview
Welcome! Today, we're going to explore SciPy, a library in Python designed for advanced mathematical and statistical computing—an extension of Numpy. One of the most significant advantages of using a powerful computing tool like SciPy is its ability to tackle complex problems that require numerous calculations, a feature which is crucial in fields such as engineering and data science, or any discipline that relies heavily on data analysis. By the end of this lesson, you'll be introduced to various useful features in SciPy, which will serve as additional tools in your data analytics toolbox.
Installing and Importing SciPy
SciPy comes pre-installed in most CodeSignal IDEs. Let's import the stats module, which provides numerous statistical functions:
Generating Distribution Data with Numpy
In statistics, distribution functions play a crucial role—they enable us to identify the probability of potential outcomes of a random event. For instance, in a dice game, the probability distribution can inform us of the chances of rolling a six. As we need some data to explore SciPy, let's firstly look at one way of generating meaningful data sample. We can utilise numpy.random module here:
In this scenario, we generate an array of 365 values, which are normally distributed with mean=30 and std=10. Note, that in numpy random, loc stands for mean, and scale stands for std.
Using Descriptive Statistics Functions in SciPy
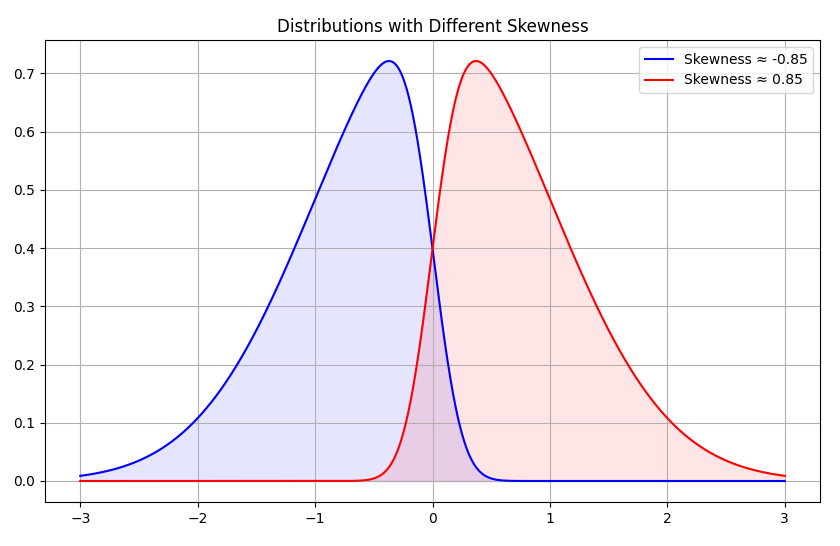
SciPy offers more statistical functions than Numpy. We'll explore two: skewness and kurtosis. Skewness measures the asymmetry of a probability distribution around its mean, while kurtosis gauges how outlier-prone a distribution is. For instance, these metrics could help us understand unusual variations in a city's annual temperature data.