Beyond labels, you can change the visual style of your plots. Customizing colors and styles isn't just about making charts pretty; it's about making them clearer and guiding your audience's attention to what's most important.
Engagement Message
What would make you choose to highlight just one bar in a bar chart?
The most common customization is changing colors. You can set the color of your bars, lines, or points by passing a color argument into the plotting method.
ax.bar(products, sales, color='skyblue')
This makes all the bars in your chart a light blue color.
Engagement Message
With me so far?
What if you want each bar to have a different color? You can pass a list of colors instead of a single one.
The first bar will be sky blue, the second salmon, and so on.
Engagement Message
What color would be the third bar?
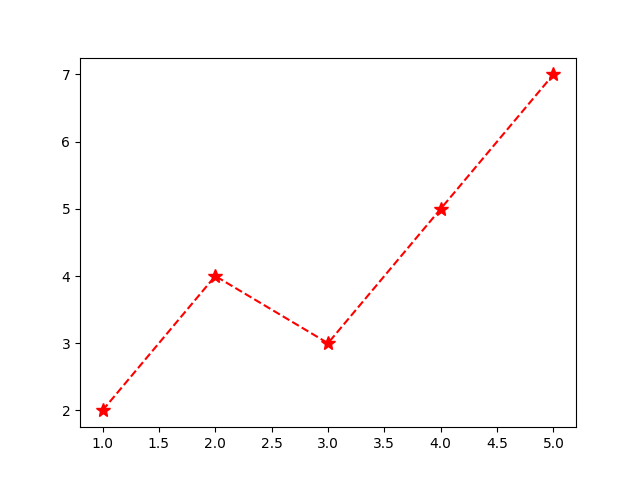
For line plots, you can also change the line style with the linestyle argument. Instead of a solid line, you can use dashed (--) or dotted (:) lines.
ax.plot(days, temps, linestyle='--')
Engagement Message
If you were plotting actual vs. projected sales, how could different line styles help clarify which is which?