Welcome back! You've mastered spotting correlations in economic data. But economists need to go deeper: how much does one variable affect another?
This is where regression analysis becomes our superpower. It measures relationships between economic variables quantitatively.
Engagement Message
In one sentence, how does regression go beyond simple correlation?
Think of regression as finding the "best fit line" through scattered data points. Imagine plotting income versus education years - dots would scatter around a general upward trend.
Regression draws the single straight line that best represents this relationship.
Engagement Message
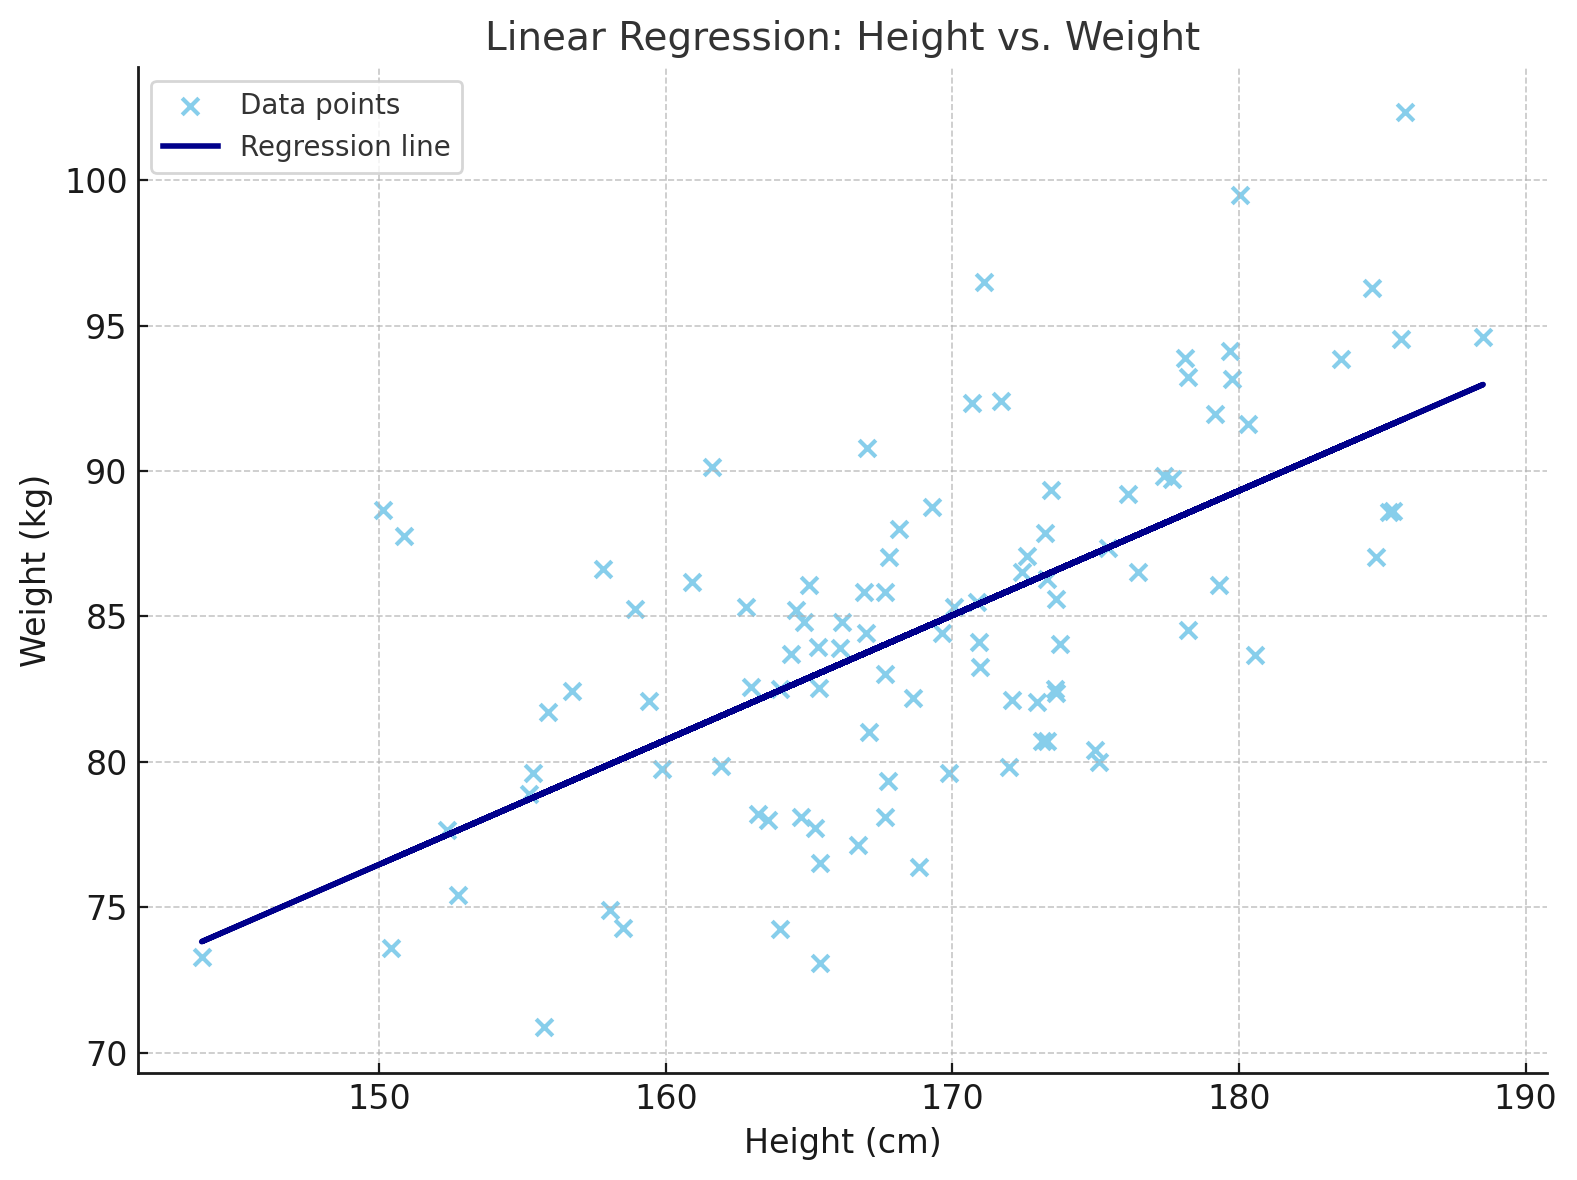
If you plotted height versus weight, what direction would the best fit line slope?
The slope of this best fit line tells us everything. A steep upward slope means the variables have a strong positive relationship. A gentle slope shows a weak relationship.
[Include this picture, do not forget it. Do not print this text]
In economics, we call this slope the "coefficient" - it measures how much Y changes when X increases by one unit.
Engagement Message
What would a negative slope between price and quantity demanded tell us?
Here's where regression gets powerful: coefficients show marginal effects. If education's coefficient is 2000, then each additional year of schooling increases income by $2000 on average.
This "per unit change" interpretation makes regression incredibly useful for economic policy decisions.
Engagement Message
How might policymakers use a coefficient linking minimum wage to employment?
Regression coefficients answer "how much?" questions that correlation cannot. Correlation only tells us variables move together. Regression tells us by how much.
