Selecting Rectangular Array Blocks
Introduction
Welcome back to Creating and Selecting from 2D NumPy Arrays. We’re now at Lesson Five, building on our work with whole rows and columns. In this lesson, we’ll place a slice in both the row and column positions to select a rectangular block from a table. We’ll practice reading slice bounds, using omitted bounds and step values, and predicting the result’s shape before printing it. By the end, we’ll be able to look at a pair of slices and tell how many rows and columns the selected block will have.
Two Slices at Once: The Row Slice Meets the Column Slice
As you may recall from the previous lesson, a colon can select every position along an axis. Now we can use a slice in both positions: the first slice chooses rows, and the second chooses columns. Each works independently, and NumPy combines the chosen rows and columns into a rectangular subtable.
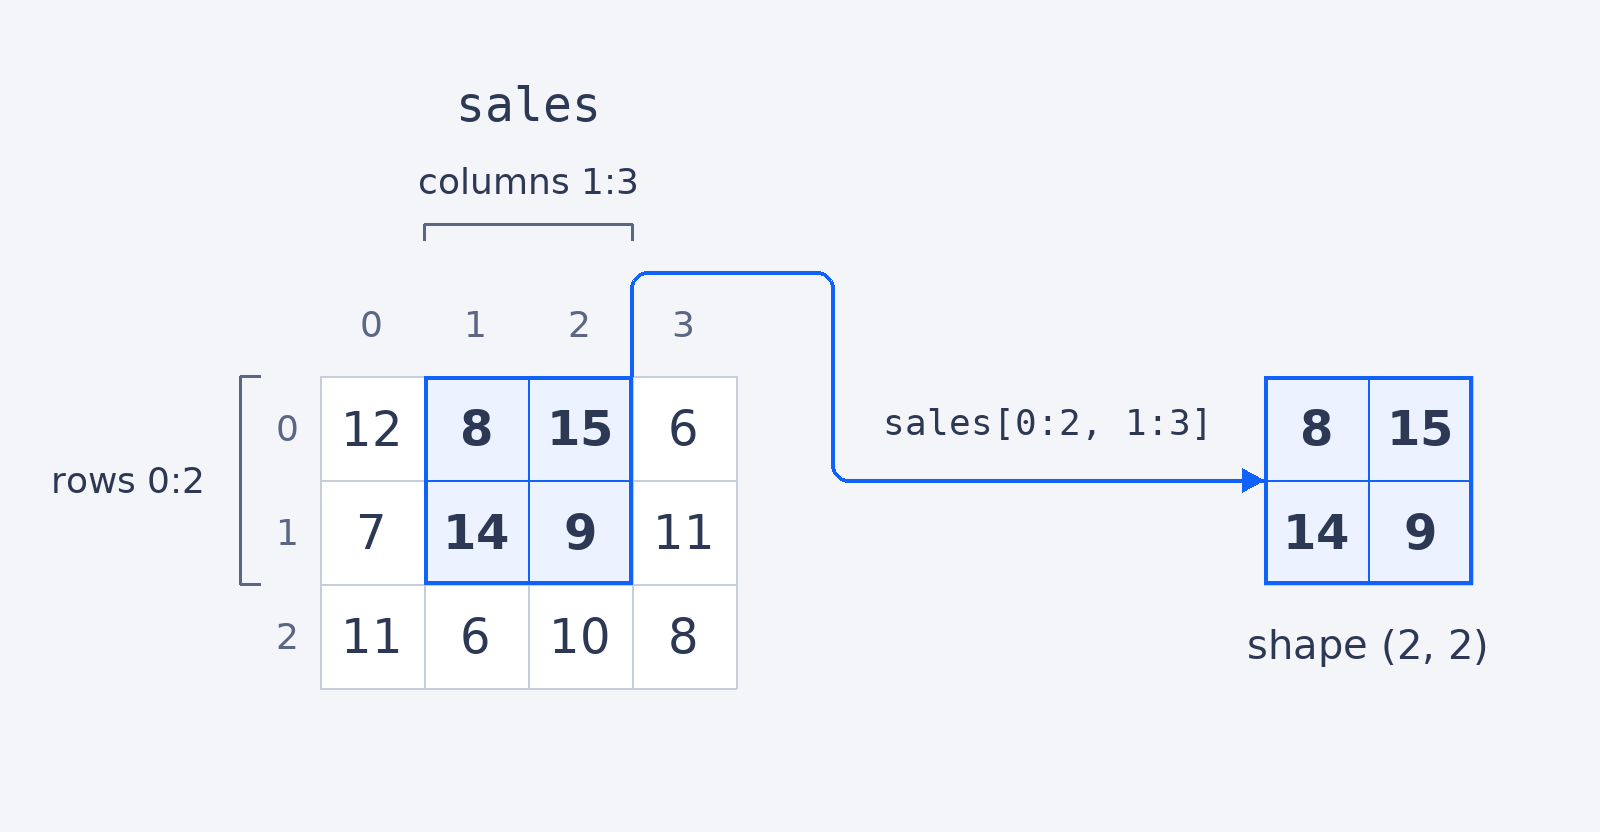
The sales table has three rows and four columns. In sales[0:2, 1:3], the row slice selects rows 0 and 1, while the column slice selects columns 1 and 2. The result contains the values at the intersections of those rows and columns. We can read its shape from the bounds: two selected rows by two selected columns.
Reading the Shape from the Bounds
Let’s check that shape before looking at the printed values. When the bounds are nonnegative and inside the table, with start <= stop and a step of 1, the number of selected positions is the stop value minus the start value. So 0:2 covers two row positions, and 1:3 covers two column positions. We can expect a (2, 2) result.
The row and column selections combine to form a smaller 2D table. Its first row comes from row 0 of sales, and its second row comes from row 1. Here is what the print statement shows:
The two values in each printed row confirm that there are two columns, and the two printed rows confirm that there are two rows. Checking the bounds first lets us predict the shape before running the code.
Two cases fall outside the subtraction rule. Reversed bounds select nothing, so sales[2:1, :] has shape (0, 4), not a negative row count. Negative bounds are counted from the end of the axis, so we convert them to positions before subtracting.
