Understanding Coordinate Planes
Introduction
Welcome to the first unit of your first course! You’ll start by learning how coordinates give precise addresses to locations on a plane—a skill you’ll build on throughout the course.
A coordinate plane lets you describe a location even when it isn’t a street corner or physical landmark. Later, you’ll use coordinates to connect graphs with tables and equations.
By the end of this lesson, you will be able to read ordered pairs in the correct order, locate points in all four quadrants, recognize points on the axes and at the origin, and plot whole-number, fractional, and decimal coordinates.
Think of the Coordinate Plane as a Map
Imagine a delivery hub at the center of a city grid. To find a package, you might travel a certain number of blocks left or right and then a certain number of blocks up or down. A coordinate plane uses the same idea, but numbers describe each location precisely.
A location is written as an ordered pair, . The first value, , describes the horizontal movement, and the second value, , describes the vertical movement. The word ordered matters: and describe different locations because the two numbers control different directions.
The point is the central reference point, called the origin. From there, positive and negative values tell you which direction to travel. With this map in mind, you can now identify its axes and regions.
Identify the Axes, Quadrants, and Signs
The horizontal number line is the -axis, and the vertical number line is the -axis. Positive -values are to the right of the origin, while negative -values are to the left. Positive -values are above the origin, while negative -values are below it.
The axes divide the plane into four regions called quadrants. Their signs provide a quick way to check whether a point is in the correct region.
| Quadrant | Sign of | Sign of | Example | Location |
|---|---|---|---|---|
| I | Positive | Positive | Upper right | |
| II | Negative | Positive | Upper left | |
| III | Negative | Negative | Lower left | |
| IV | Positive | Negative | Lower right |
Quadrants are numbered counterclockwise, beginning in the upper-right region. A point with a zero coordinate lies on an axis, so it is not assigned to a quadrant.
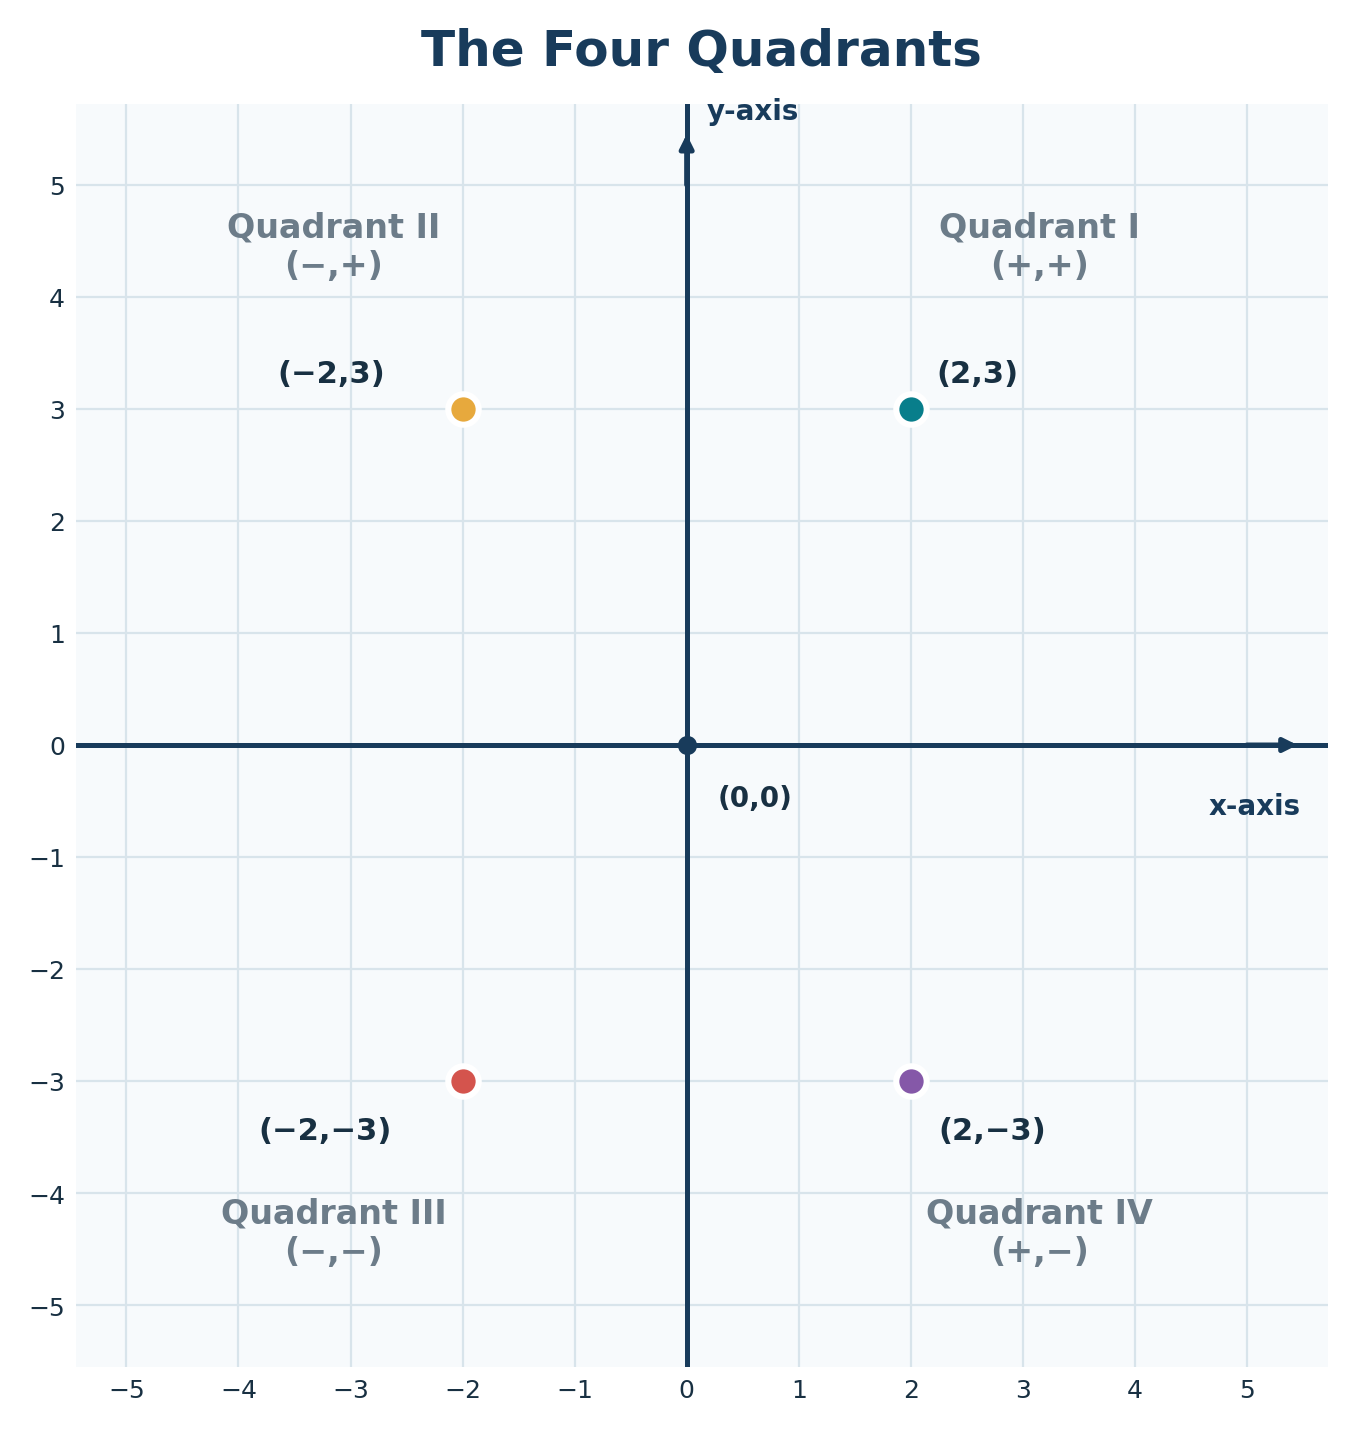
The signs tell you the general region, but the order of the two values tells you the exact location. Next, you will practice reading that order directly from a graph.
Read Coordinates in the Correct Order
When you read a plotted point, use the axes as guides. Imagine a vertical line from the point to the -axis and a horizontal line from the point to the -axis.
- Check the labels and spacing on both axes.
- Follow the vertical guide to the -axis and read the horizontal value.
- Follow the horizontal guide to the -axis and read the vertical value.
- Write the values in the order , including their signs.
For example, a point that is units to the right and units below the origin has and . Its coordinates are , not . In fact, because switching the coordinates moves the point to a different quadrant.
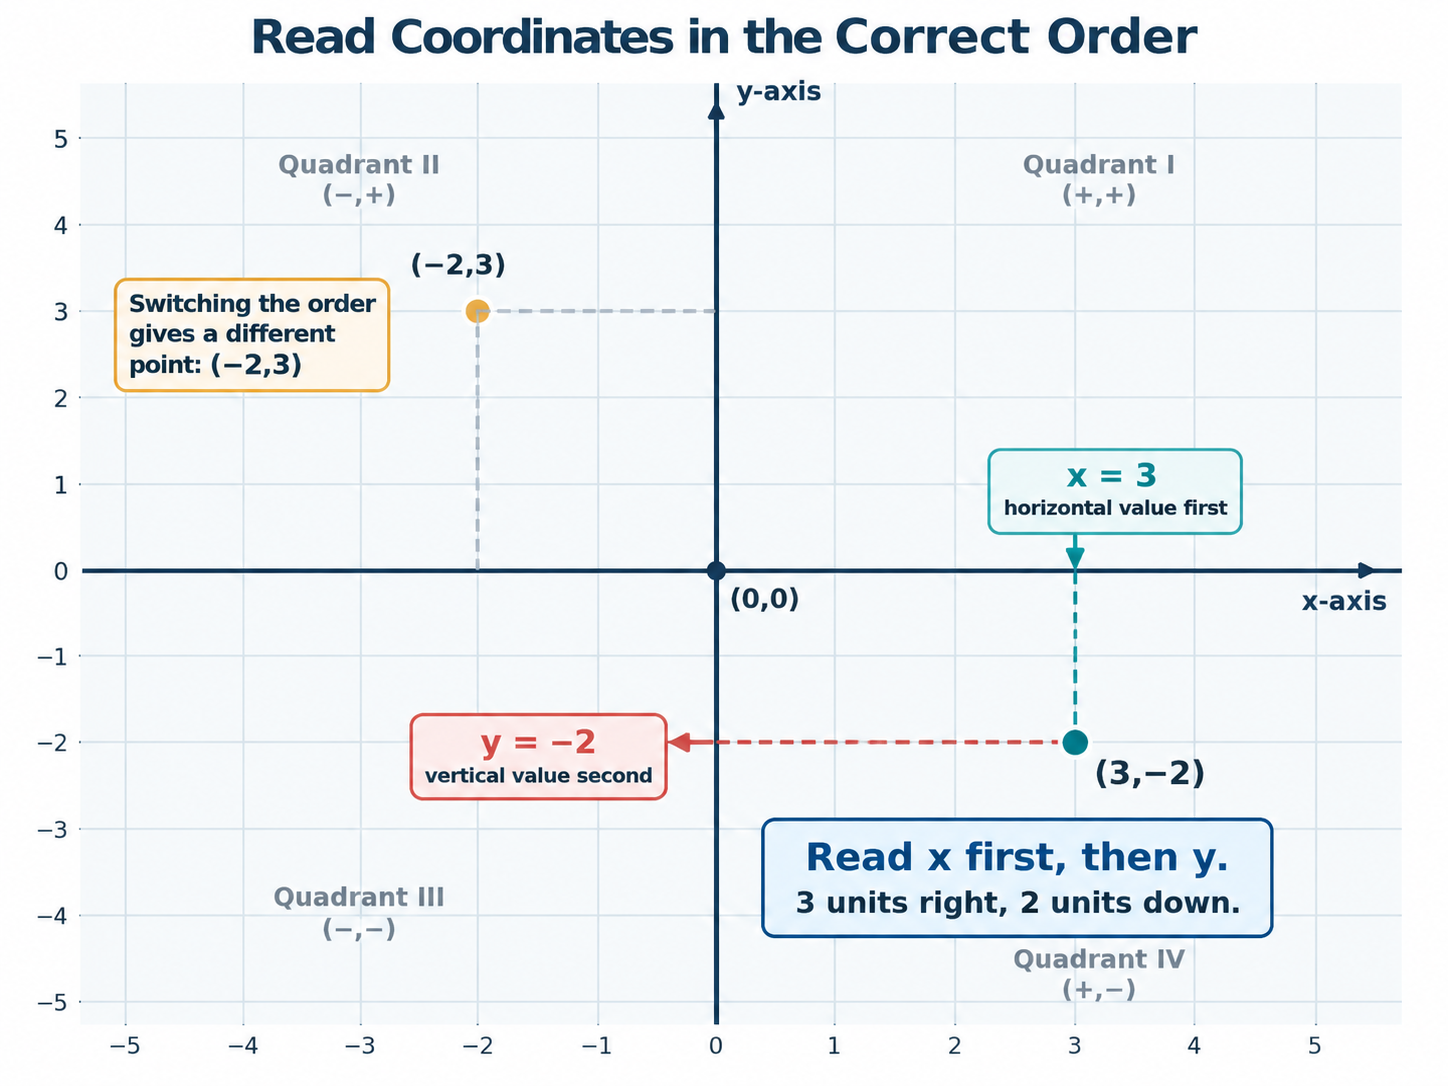
Reading takes you from a visible point to its numerical address. Plotting reverses that process: you start with the address and create the visible point.
Plot an Ordered Pair
To plot an ordered pair, begin at the origin and follow the coordinates in their stated order.
- Start at .
- Use the -coordinate first: move right for a positive value or left for a negative value.
- Use the -coordinate second: move up for a positive value or down for a negative value.
- Mark the final location and label the point if needed.
To plot , start at the origin, move units left, and then move units up. The point belongs in Quadrant II.
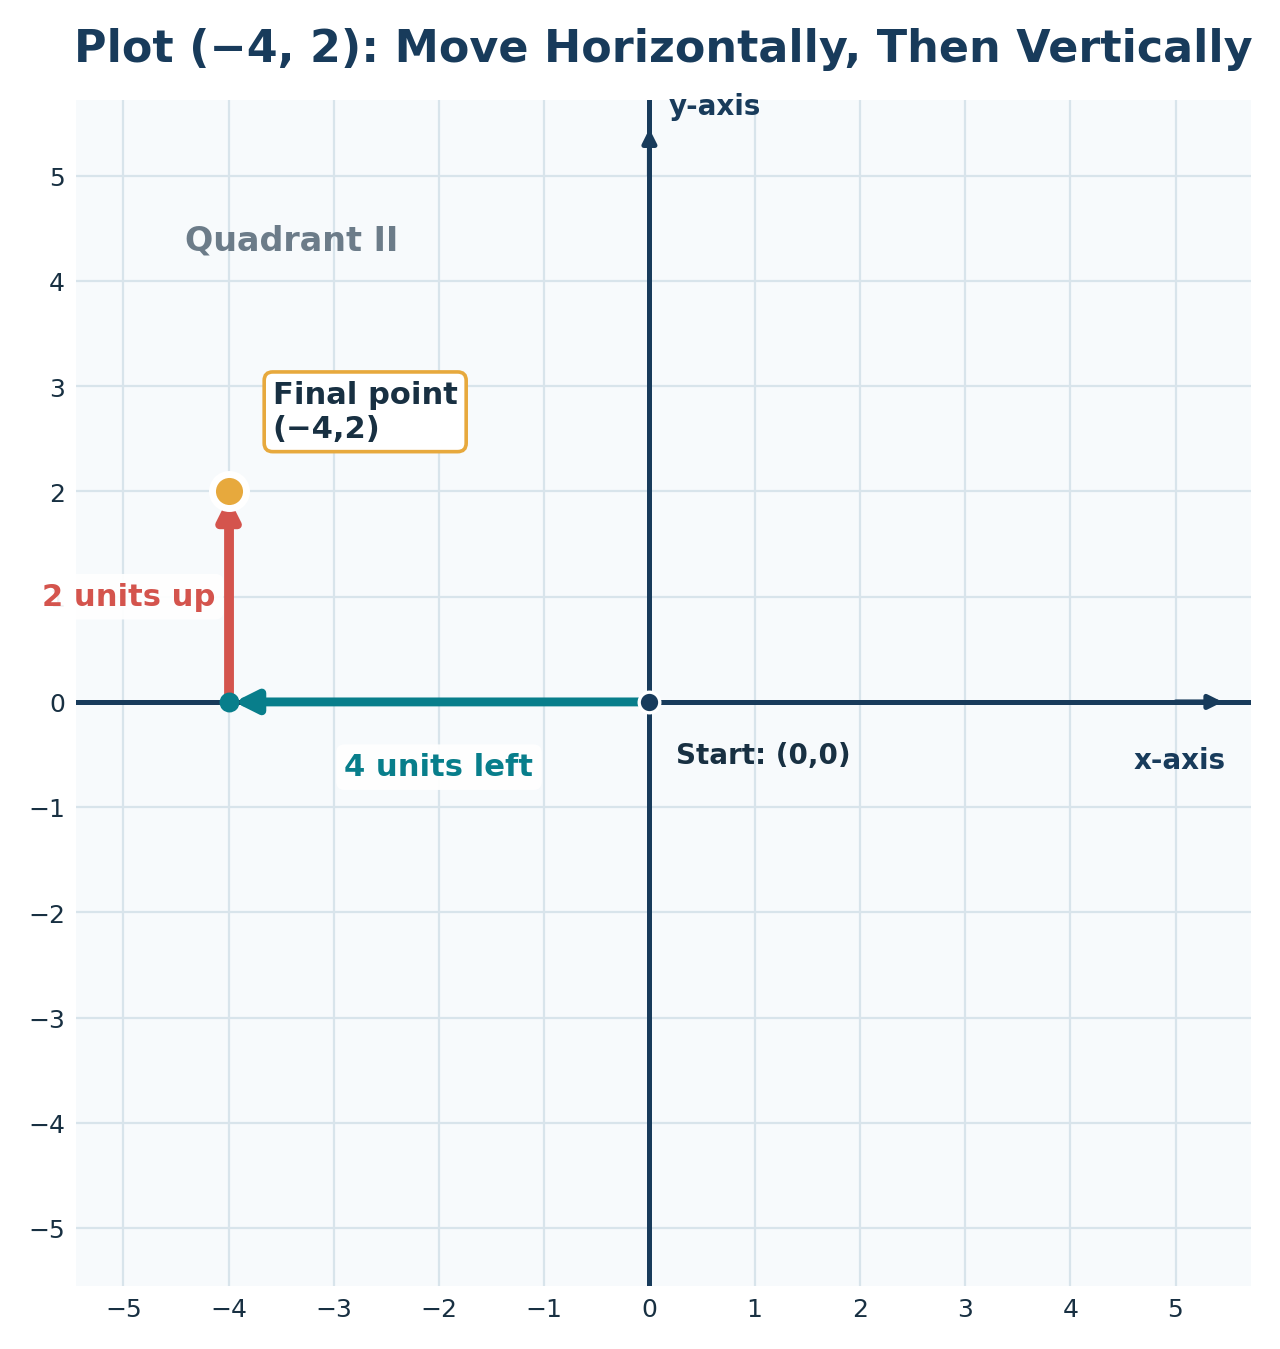
On a delivery grid, this same routine could place a package at : move four blocks east and two blocks north from the hub. The coordinate pair gives everyone the same instructions, so the location does not depend on guessing or measuring by eye. A zero coordinate changes the routine only by removing movement in one direction.
Recognize Points on the Axes and at the Origin
A zero coordinate means there is no movement along that axis. This makes points on the axes easy to recognize from their forms.
| Coordinate form | Location | Example | Meaning |
|---|---|---|---|
| -axis | No vertical movement | ||
| -axis | No horizontal movement | ||
| Origin | No horizontal or vertical movement |
In these forms, and may be positive or negative. The origin lies on both axes, but it does not belong to any quadrant. Once you can handle zero values, the same plotting routine extends naturally to coordinates that are not whole numbers.
Read and Plot Fractional and Decimal Coordinates
A graph does not always use one whole unit for each small interval. The labels on an axis, rather than the visual size of a square, determine the scale. To find the value of one interval, divide the difference between two labeled values by the number of equal intervals between them:
Use this rule as your first step on any scaled graph:
- Find two labeled values on the axis, such as and .
- Count the equal spaces between those labels, not the tick marks.
- Divide to get the value of one interval.
- Repeat for the other axis, because the two scales can differ.
For example, if the distance from to is divided into two equal intervals, each interval represents because . If it is divided into four intervals, each represents . If it is divided into five intervals, each represents .
Plotting with a fractional scale. Suppose each interval on both axes represents . To plot , move three intervals right because , then move two intervals down because . The point lies in Quadrant IV.
Plotting with a decimal scale. If each interval represents , then plotting means moving four intervals right because and two intervals down because .
Reading a point on a scaled graph. Reverse the process: count the intervals from the origin to the point, then multiply by the value of one interval. On axes scaled by , a point that sits three intervals left of the origin and one interval above it has and , so its coordinates are .
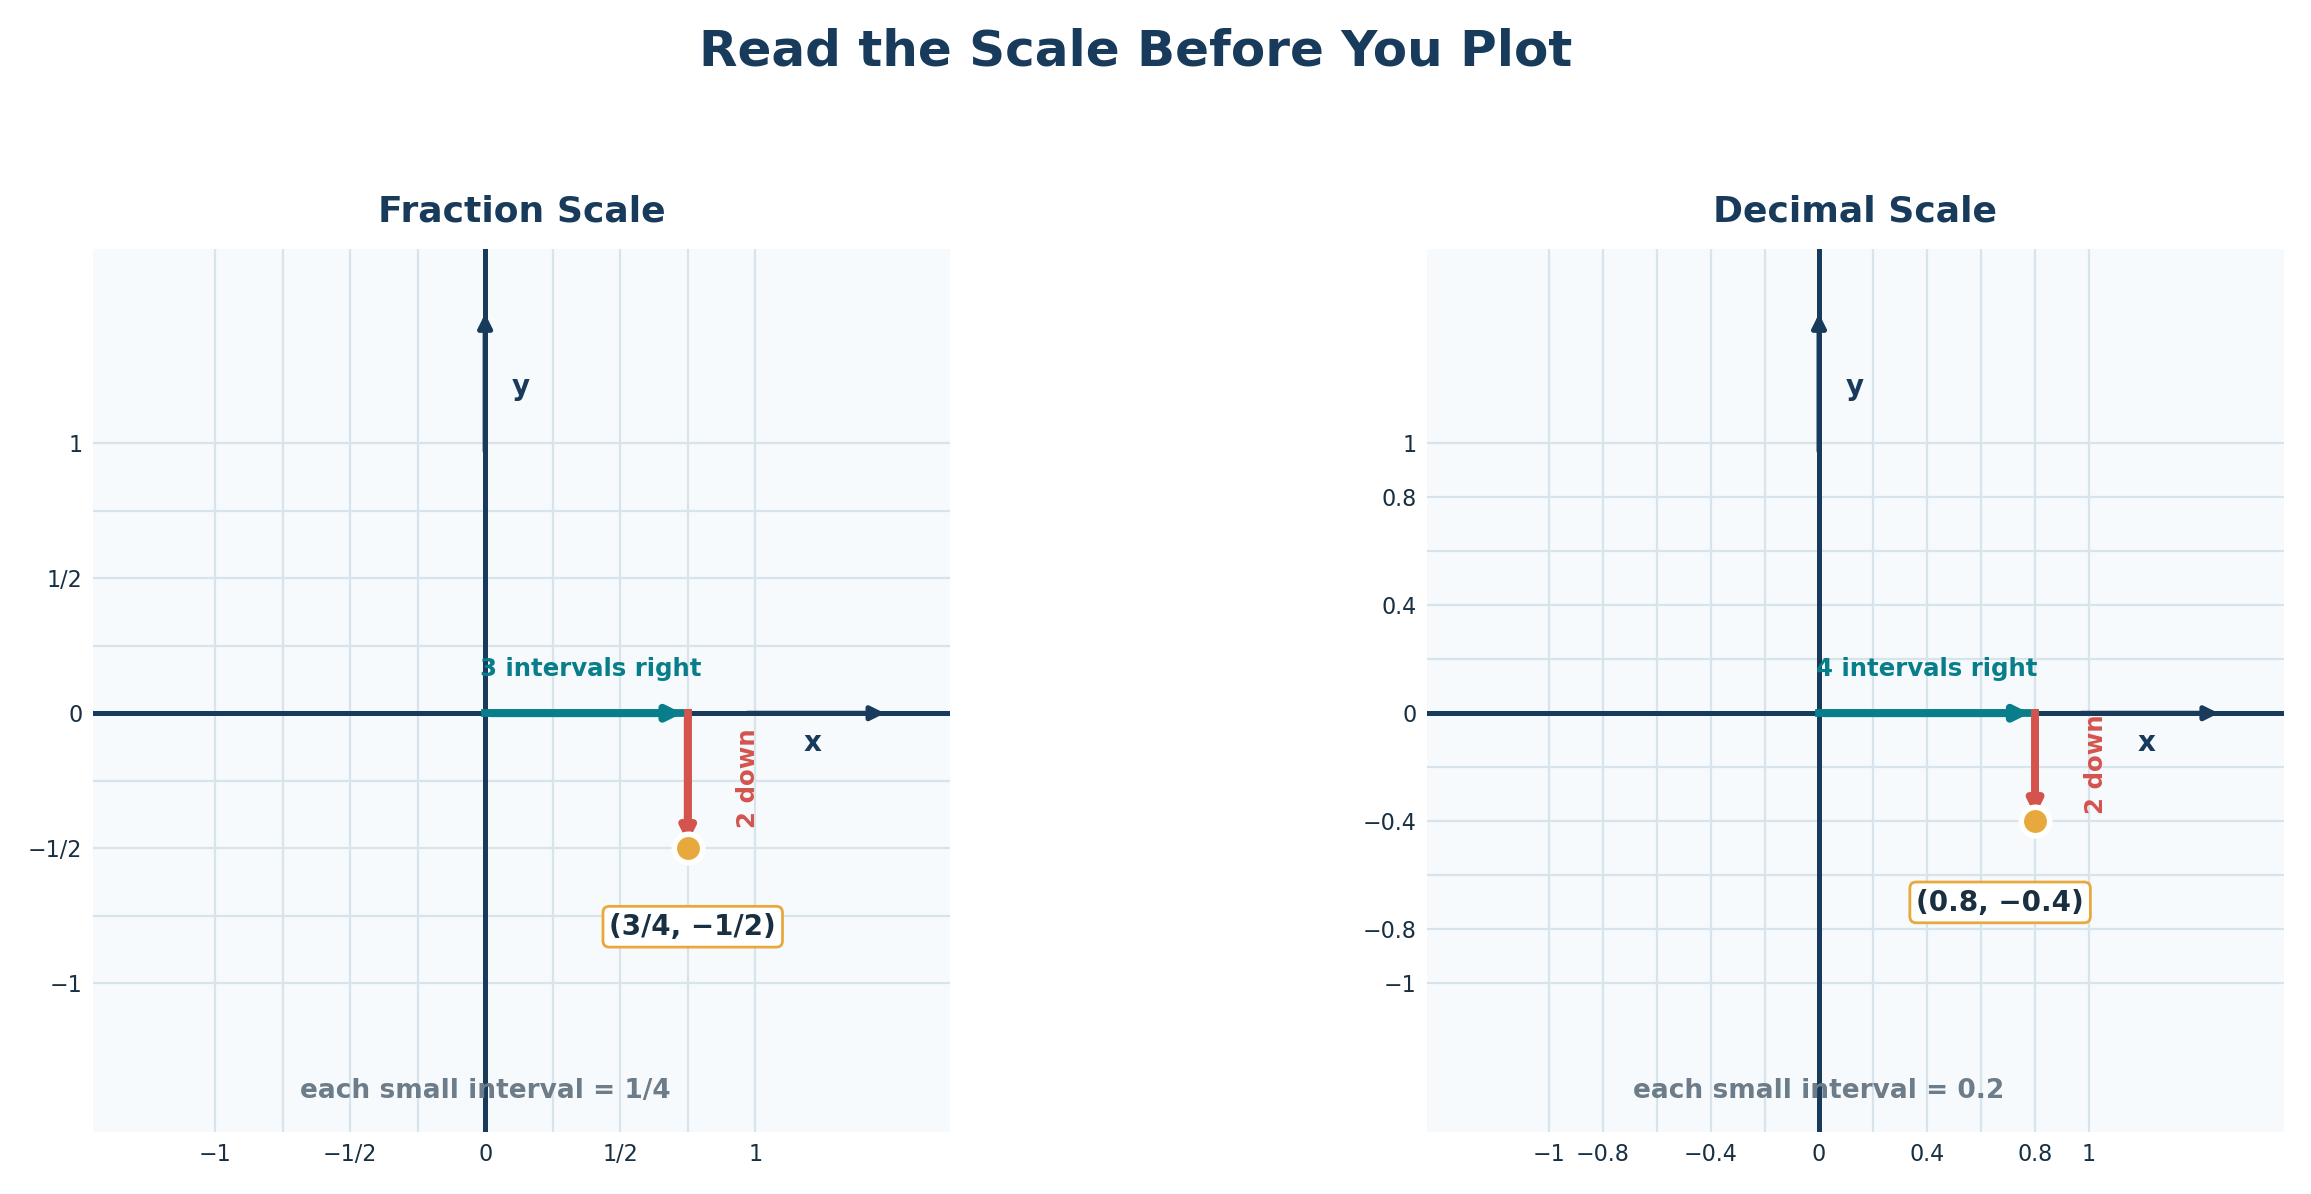
The same horizontal-then-vertical process works for whole numbers, fractions, and decimals; only the scale changes. Because a non-unit scale can make a point look misleading, a final check is useful before you accept your answer.
Check Your Work and Avoid Common Mistakes
Use the following checks to catch errors before moving on.
| Possible mistake | Quick check |
|---|---|
| Reversing the coordinates | Did you read the horizontal value first and the vertical value second? |
| Moving in the wrong direction | Does a negative -value move left, and does a negative -value move down? |
| Misreading the scale | Did you count intervals and check the labels on each axis? |
| Ignoring a zero | Does a zero coordinate place the point directly on an axis? |
| Choosing the wrong quadrant | Do the signs of the coordinates match the point's location? |
For example, must be to the left of the origin on the -axis. If your point is above or below the axis, revisit the zero coordinate; if it is to the right, revisit the negative -value. These quick checks help you work accurately without starting the entire problem over.
Conclusion and Next Steps
Coordinates turn locations into precise addresses on a plane. In this first lesson, you learned to read the horizontal coordinate before the vertical one, use signs to identify quadrants, recognize axes and the origin, and plot whole-number, fractional, and decimal coordinates.
In the practice section that follows, you will first select correctly ordered coordinates and read points across the plane. You will then plot whole-number locations and finish with fractional or decimal points on scaled axes. Use the axis labels and the final-check table whenever you want to verify a result.
