Reading Function Graphs
Introduction
An ordered pair can describe not only where something is, but also what happens in a process. This is the second lesson in Coordinates and Function Representations. In the first lesson, you learned to read the two coordinates accurately; now you will use those coordinates as an input-output record.
Imagine a graph for a ride-share fare. The point could mean that a 4-mile trip costs . If you know the distance, you can look up the fare; if you know a fare, you can ask which distances produce it.
By the end of this lesson, you will be able to:
- Find an output when a graph gives you an input.
- Find every input that produces a specified output.
- Distinguish between one matching input, several matching inputs, and no matching inputs.
From Coordinates To Relationships
You already know that the first coordinate describes horizontal position and the second describes vertical position. A function assigns exactly one output to each allowed input. Its graph shows the input-output pairs as points on a coordinate plane. In a function graph, those coordinates also have jobs: represents the input, and represents the output.
For example, if is the number of minutes spent exercising and is the number of calories burned, the point means that 30 minutes is paired with 240 calories. The meaning of the numbers depends on the situation, but the graph-reading process stays the same.
A function graph acts like a visual lookup tool. You begin with an input on the horizontal axis, find the graph above or below it, and then read the related output on the vertical axis. Function notation gives this relationship a concise name.
Use Function Notation
If a function is called , then means “the output of function when the input is .” Read as “ of ,” not as multiplication.
The connection between function notation and coordinates is:
For example, means that the graph contains the point . A function has one output for each input in its domain, but different inputs may still have the same output. That difference becomes important when you work backward from an output.
With the notation in place, you are ready to trace a specified input through a graph.
Trace An Input To Its Output
To find from a graph, begin at the input on the -axis. Then use the graph to locate the corresponding vertical coordinate.
- Locate on the -axis.
- Move vertically until you reach the graph.
- From the graph, move horizontally to the -axis.
- Read the output and write the result as .
Suppose a graph passes through the point . Starting at , you move vertically to the graph and then read across to . Therefore, .
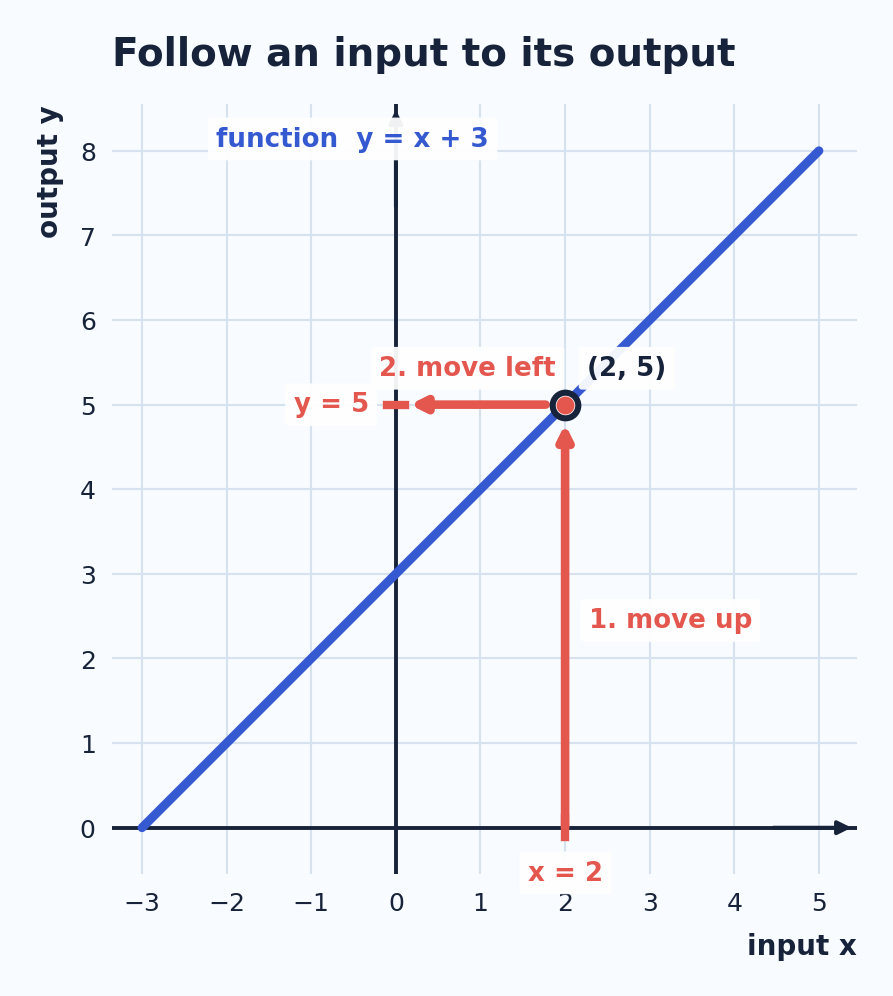
Use the labels on the axes rather than assuming that each grid interval represents one whole unit. For example, an intersection halfway between and may have an -coordinate of . The same tracing routine works for negative, fractional, and decimal inputs.
If the vertical line at reaches no included point on the graph, then is not in the function’s domain, so the function has no output for that input. An open circle by itself does not count as an included point.
Read The Exact Graph Point, Not The Overall Shape
A graph’s shape can help you understand its general behavior, but it does not give the exact output by itself. Read the coordinate at the specified input, whether the graph is a line, a curve, a parabola, or a V-shape.
| Point on the graph | Function statement | Meaning |
|---|---|---|
| An input of gives an output of | ||
| An input of gives an output of | ||
| An input of gives an output of |
For instance, if a curved graph passes through , you still read exactly as you would for a straight line. Do not estimate from whether the graph appears to be rising or falling. Follow the axis labels to the actual point where the input meets the graph.
Once you can move from one input to its output, you can reverse the process.
Work Backward From An Output
Sometimes the output is given first, and you need to find every input that produces it. For an output of , you are looking for all solutions to .
- Locate on the -axis.
- Move horizontally along the line .
- Mark every included point where this horizontal line meets the graph.
- Move vertically from each intersection to the -axis.
- Record every corresponding input.
Suppose the line meets a graph at and . Both inputs produce an output of , so and .
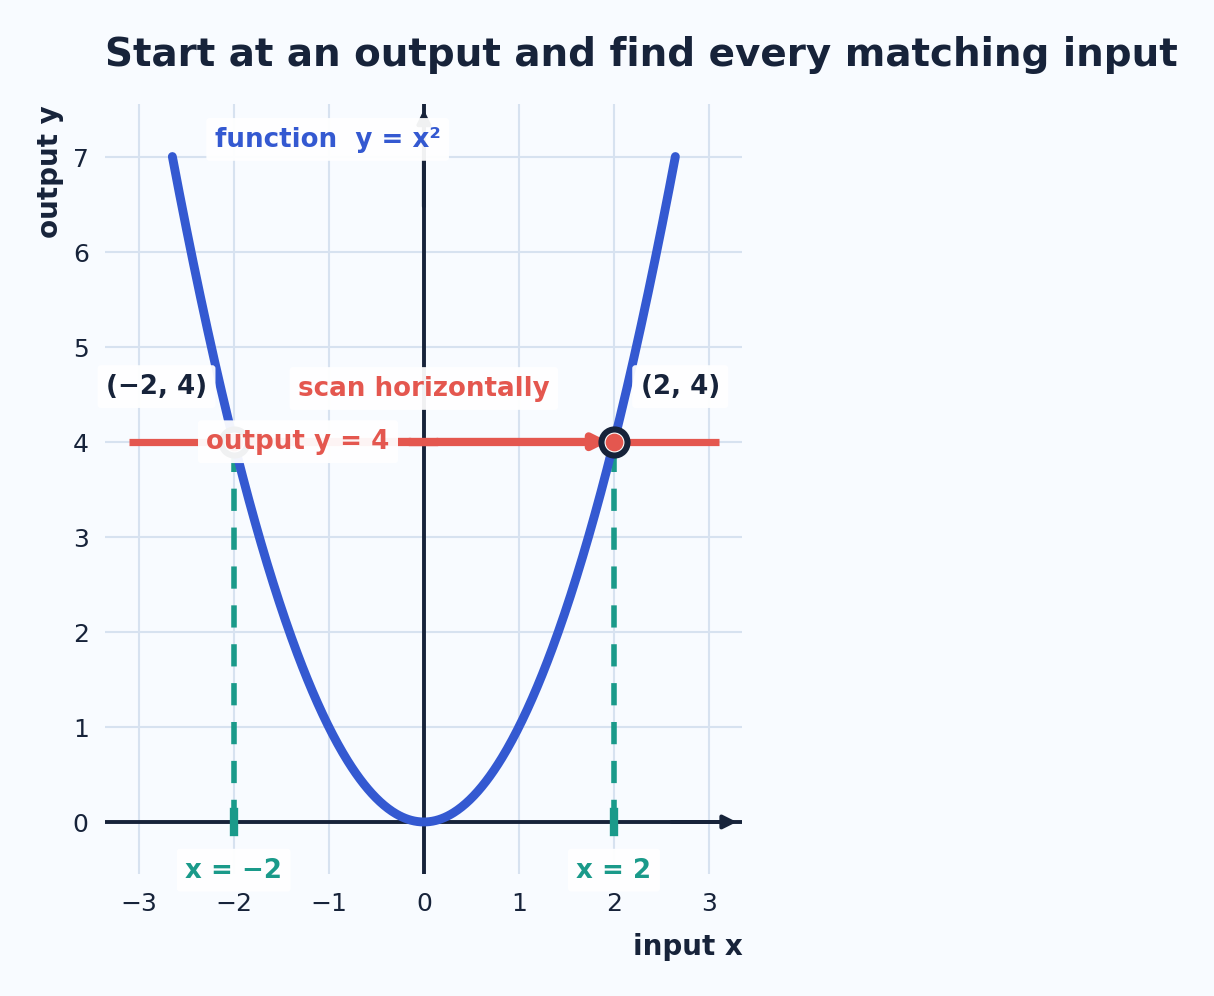
The word every matters. If a horizontal line crosses the graph more than once, stopping at the first intersection gives an incomplete answer. Record all of the intersections before reporting the matching inputs.
Why Multiple Inputs Can Share An Output
The function rule says that one input cannot produce two different outputs. It does not say that one output must come from only one input.
A vertical line is useful for checking the function rule: it can meet a function graph at no more than one included point. A horizontal line asks a different question, so it may meet the graph zero times, one time, or several times.
| Line used | Question it answers | Possible result |
|---|---|---|
| Vertical line | What is the output for this input? | At most one output |
| Horizontal line | Which inputs produce this output? | No input, one input, or multiple inputs |
The graph of provides a simple example:
The inputs and share the output , but each input still has only one output. In a real-world graph of a ball's height over time, the ball may reach the same height once while rising and again while falling. Different times can therefore correspond to the same height.
Decide Whether An Output Is Attained
An output is attained when at least one input produces it. The range of a function is the set of all outputs the graph actually reaches, so a target output is attained exactly when its horizontal line intersects the graph at an included point.
Consider the function
Because is never negative,
The graph therefore has the following possibilities:
| Target output | Matching inputs | Result |
|---|---|---|
| None | No matching input, because every output is at least | |
| One matching input | ||
| and | Two matching inputs |
For the last row, the equation confirms what the horizontal scan shows:
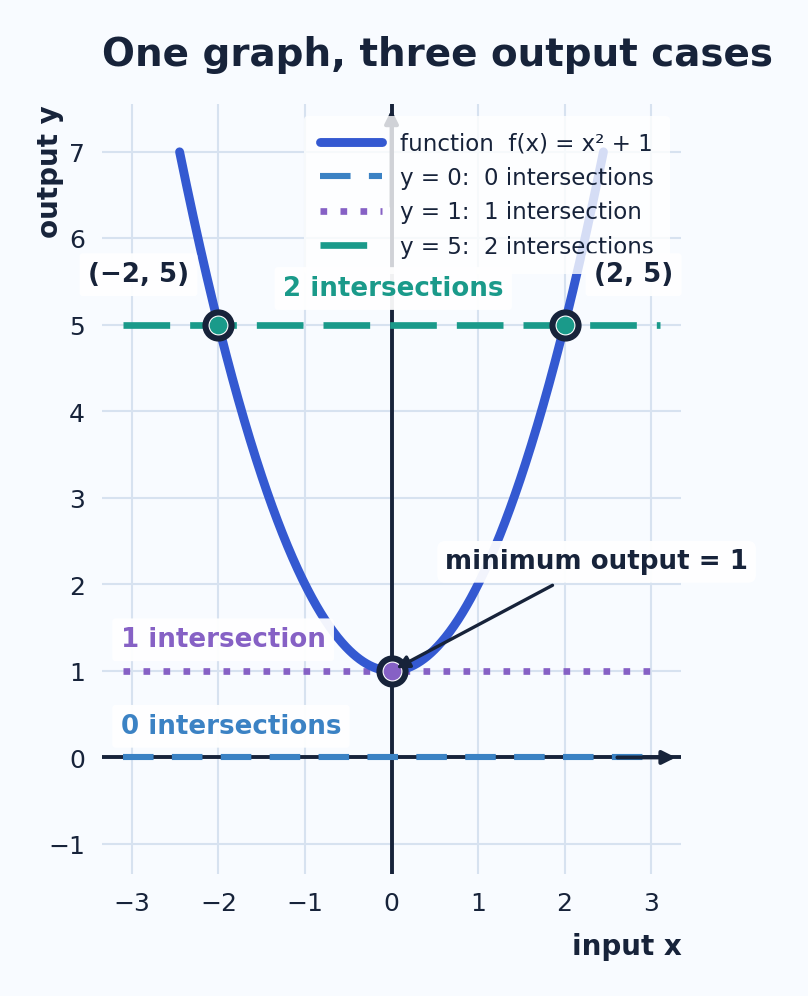
When deciding that an output is not attained, do not rely only on the visible edge of the graphing window. Use arrows, labeled endpoints, an equation, or clearly indicated range information to determine how far the graph continues. A solid endpoint belongs to the graph, while an open endpoint does not.
Choose The Reading Direction
You have now seen both directions of graph reading. Use the following comparison to choose the correct starting axis and movement.
| Given information | Start at | Move toward the graph | Then move | Record |
|---|---|---|---|---|
| Input | on the -axis | Vertically | Horizontally to the -axis | One output, |
| Output | on the -axis | Horizontally | Vertically to the -axis | Every matching input |
A useful memory guide is: input to output means vertical, then horizontal. Output to inputs means horizontal, then vertical. This direction check helps you avoid treating the two coordinates as interchangeable.
Check Common Mistakes
Before accepting your answer, use these checks:
- Starting on the wrong axis: Begin with an input on the -axis and an output on the -axis.
- Reversing the coordinates: Report the horizontal value as the input and the vertical value as the output.
- Stopping at the first intersection: When searching for inputs, continue across the entire target horizontal line.
- Counting an open circle: An open circle is not part of the graph unless another included point answers the question.
- Treating the viewing window as a boundary: The graph may continue beyond what is currently visible.
- Guessing from the shape: Read the labeled coordinates instead of estimating from the graph’s general direction.
These checks are especially useful when the graph has a nonlinear shape, a non-unit scale, or more than one intersection. They also help you distinguish a true no-solution case from a graph-reading error.
Conclusion And Next Steps
Function graphs turn ordered pairs into input-output records. To find an output, start at an input on the -axis, move vertically to the graph, and read across; to find inputs for an output, start on the -axis, move horizontally, and record every included intersection. A target output may have one matching input, several, or none.
Next, the practice section will ask you to choose the correct tracing direction, read values from linear and nonlinear graphs, find every input for a given output, and recognize an unattained output. Use the axis labels, endpoint markers, and graph behavior as evidence rather than relying on the graph’s shape or visible window alone.
