Pairing Center and Spread
Introduction
Welcome to Comparing and Communicating Distributions, the fifth and final course in this learning path! Over the previous four courses, we built a solid toolkit: reading distributions from graphs, computing measures of center, measuring spread with range and IQR, and calculating standard deviation. Now it is time to bring all of those tools together and learn how to use them wisely.
In this first lesson, we tackle a practical question that comes up whenever we summarize a distribution: which center measure should we pair with which spread measure? The answer depends on the shape of the data, and choosing the wrong pairing can paint a misleading picture. By the end of this lesson, you will know exactly how to make that choice and why it matters.
Why Center and Spread Travel Together
A measure of center on its own only tells half the story. Imagine hearing that the average daily temperature in two cities is . That sounds identical, but one city might stay between and all year while the other swings from to . Without a spread measure, we cannot tell these two very different realities apart.
As you may recall from previous courses, we have two main measures of center (the mean and the median) and two commonly used measures of spread (the standard deviation and the IQR). That gives us four possible combinations, but only two of them make sense as standard practice. Let's see which two and why.
The Two Standard Pairings
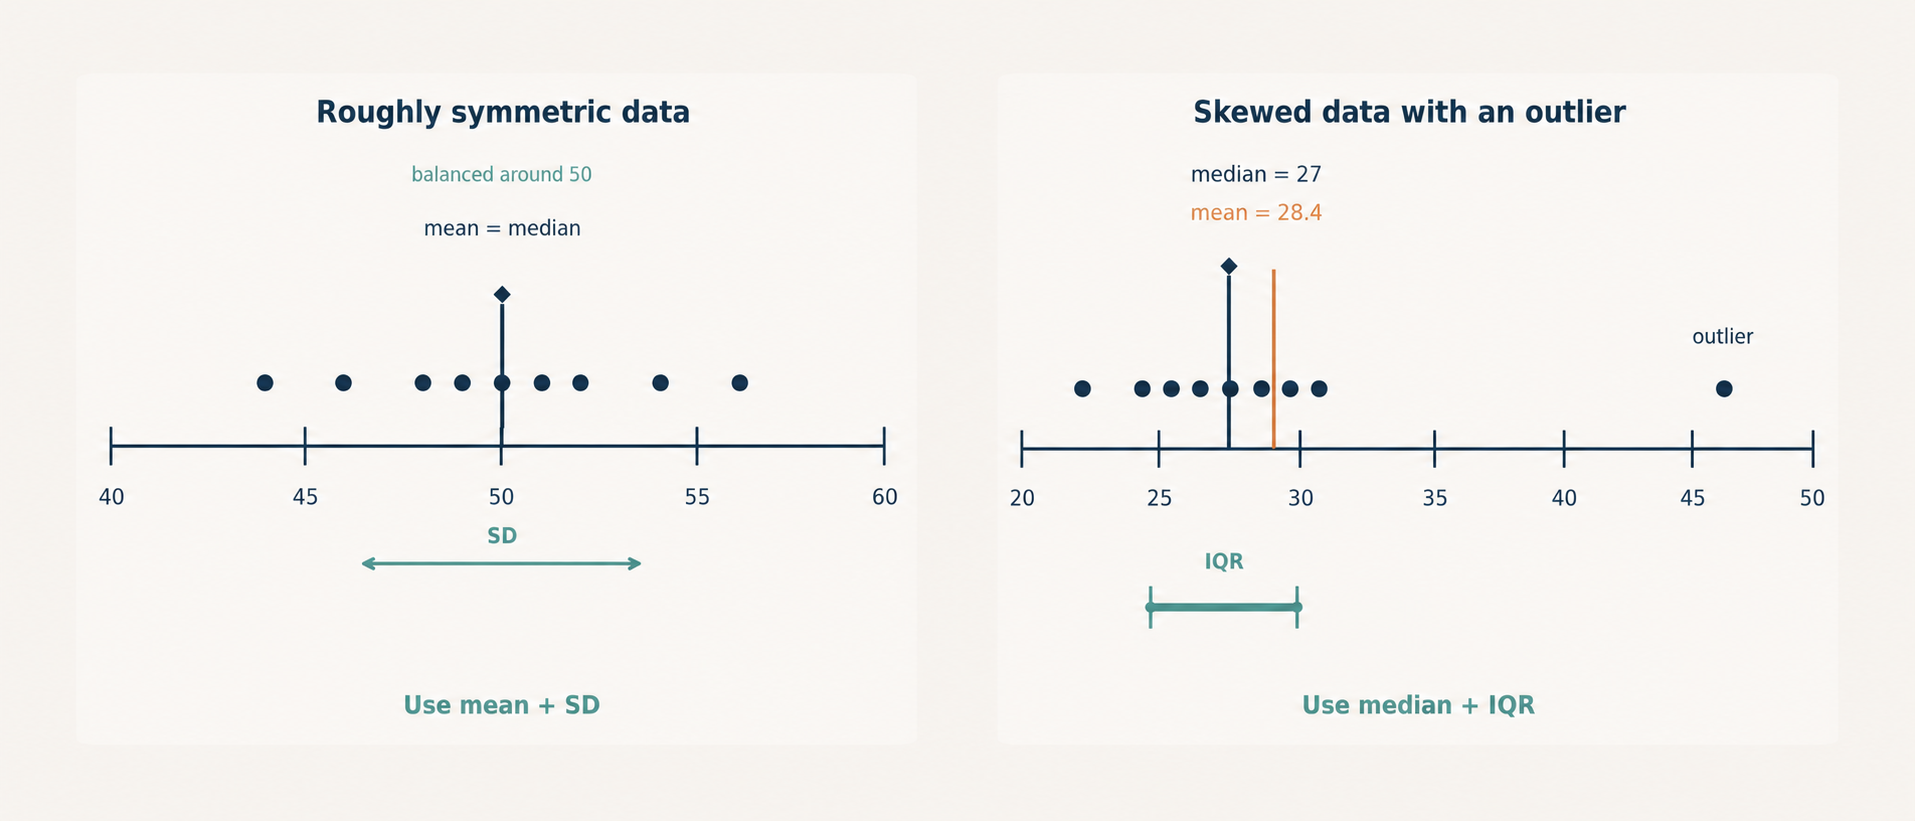
Out of four possible combinations, only two are used in standard practice:
| Pairing | Center | Spread | Best For |
|---|---|---|---|
| Pairing A | Mean | Standard Deviation (SD) | Roughly symmetric data |
| Pairing B | Median | IQR | Skewed or outlier-prone data |
The other two combinations — mean with IQR and median with SD — are rarely used because they mix measures that respond to the data in fundamentally different ways. The next section explains why that mixing creates problems.
What Makes Each Pairing Click
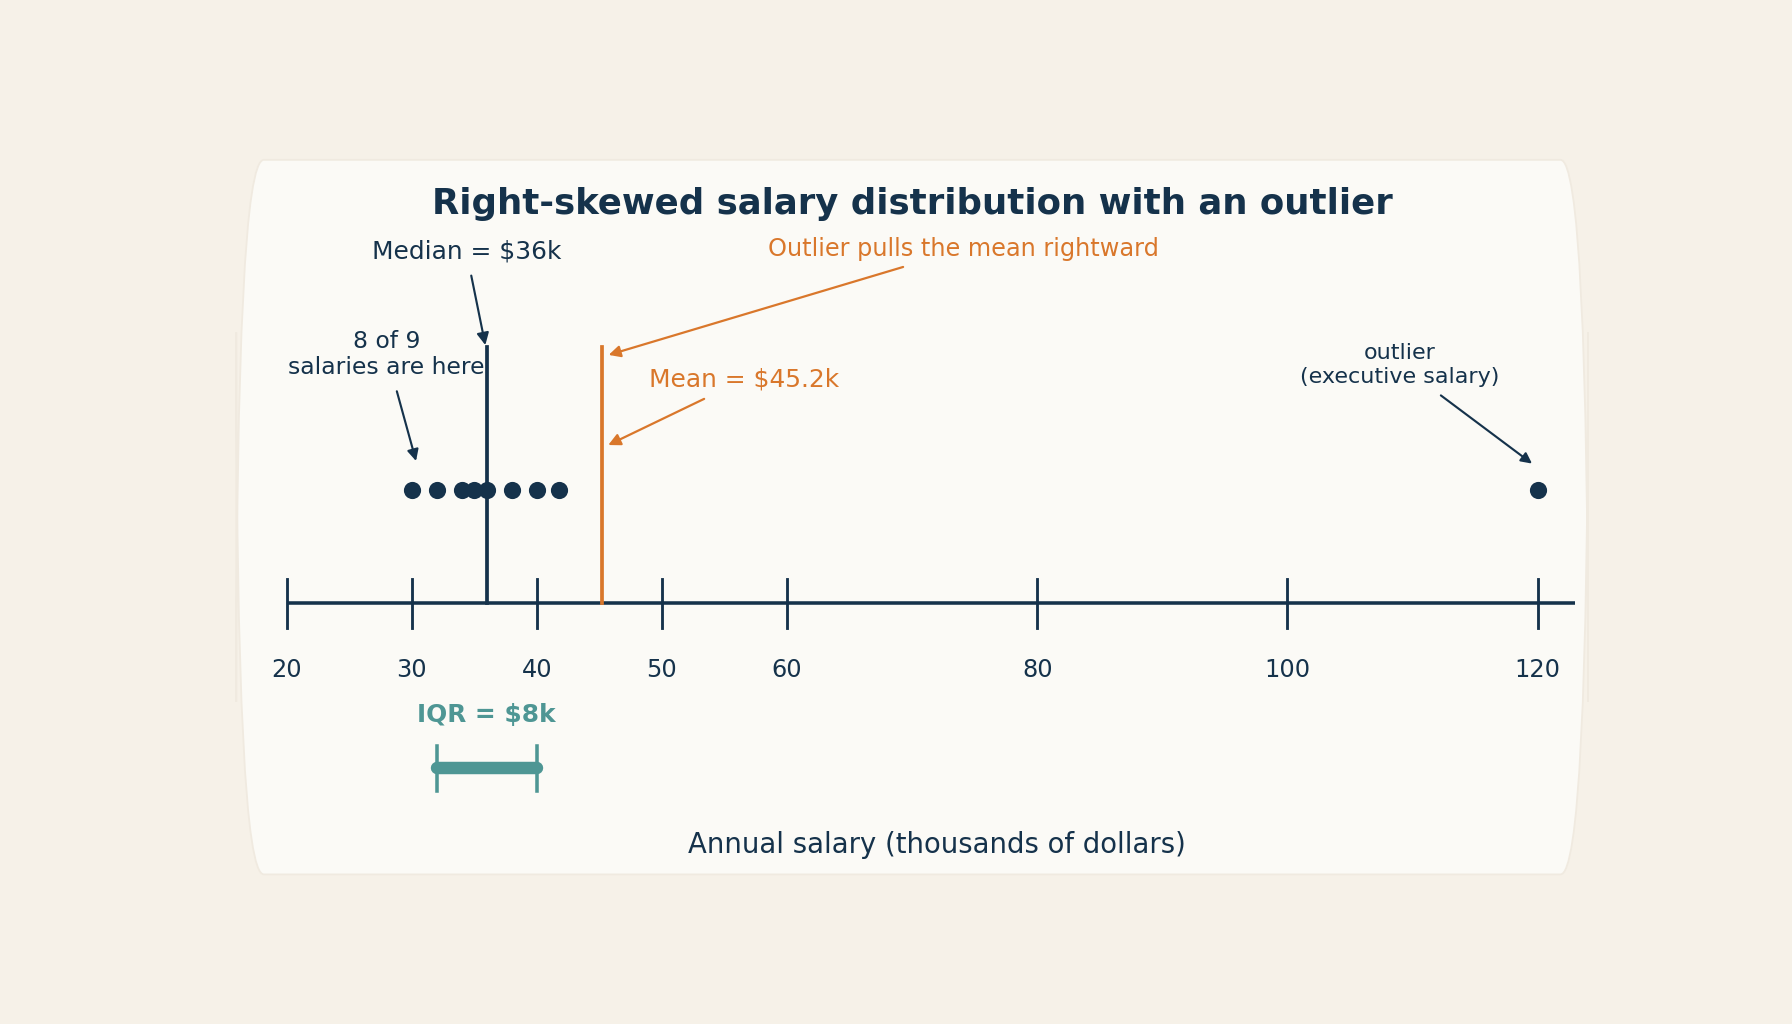
The key idea is outlier sensitivity. As we explored in earlier courses, the mean and standard deviation are both pulled strongly by extreme values. If one unusually large value enters the dataset, the mean shifts toward it and the SD inflates to reflect that extra distance. They react together.
The median and IQR, on the other hand, are both resistant. The median sits at the middle position regardless of how extreme the endpoints are, and the IQR only measures the spread of the middle . An outlier barely moves either one.
When we pair a sensitive center with a sensitive spread (mean + SD), both measures tell a consistent story. The same is true when we pair two resistant measures (median + IQR). Mixing one sensitive measure with one resistant one would be like describing a city's weather using the average temperature but only the range of the middle four months — the pieces would not fit together, and the summary would send mixed signals.