Welcome to today's discussion on Hierarchical Clustering. We will study its effectiveness using the Silhouette Score, the Davies-Bouldin Index, and Cross-Tabulation Analysis. We will utilize R's powerful packages, such as cluster, factoextra, and dplyr, to equip you with practical and useful skills for evaluating clustering models.
R provides robust tools for hierarchical clustering through functions like hclust and dist. In this lesson, we will use these functions to perform hierarchical clustering on a small dataset.
Let's start by creating our data and applying hierarchical clustering:
This code applies hierarchical clustering to our dataset. The resulting cluster assignments are stored in cluster_labels.
The Silhouette Score offers a measure to evaluate the effectiveness of our clustering. This score gauges how similar a point is to its own cluster compared to other clusters. Higher scores indicate better clustering.
In R, we can use the silhouette function from the cluster package to compute the Silhouette Score:
The output provides a single score showing the effectiveness of our clustering.
The Davies-Bouldin Index evaluates the average similarity between clusters. A lower index value indicates a better model.
In R, we can use the clusterSim package's index.DB function to compute the Davies-Bouldin Index:
The Davies-Bouldin Index thus obtained serves as another measure of our clustering effectiveness.
Visualizing the clustered data points provides an intuitive understanding of our clusters. For this, we will use ggplot2 for plotting and dplyr for cross-tabulation analysis.
Cross-Tabulation Analysis provides an overview of how data points have been assigned to clusters.
The resulting table showcases the distribution of data points across our clusters.
Now, let's visualize the clusters using ggplot2:
Output:
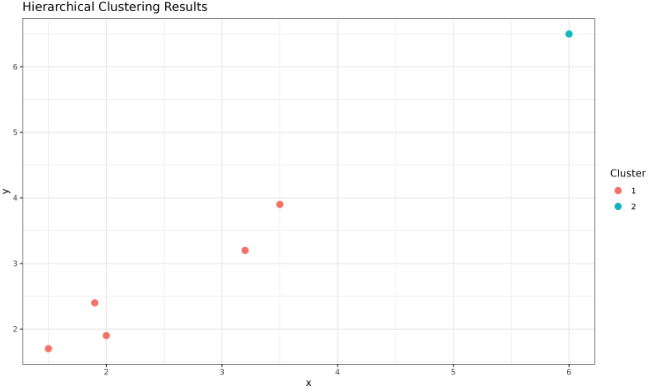
This scatter plot presents colored data points according to their respective clusters, providing a clear and direct view of the various clusters formed based on our data.
You are now equipped with the skills to apply the Silhouette Score, the Davies-Bouldin Index, and Cross-Tabulation Analysis in assessing hierarchical clustering results. These tools enable you to confidently interpret and evaluate clustering models. Remember, these skills are applicable beyond hierarchical clustering. So, let's continue refining these capabilities through practice. Keep learning!
