Understanding Representative Samples
Introduction
Welcome to Choosing Samples You Can Trust, the second course in our learning path! In the previous course, we explored what populations and samples are, and why collecting data from a sample is often more practical than measuring an entire population. Now it is time to ask a deeper question: how do we know whether a sample is any good?
Not all samples are created equal. A sample can be the right size and still paint a misleading picture if it does not reflect the group it is supposed to represent. In this first lesson, we will unpack what it means for a sample to be representative and learn how to judge whether a particular sample matches its population in the ways that actually matter.
A Taste Test Analogy
Imagine you are stirring a big pot of soup and want to check whether it needs more salt. You scoop out a small spoonful and taste it. That spoonful is your sample, and the whole pot is your population. The taste test works because stirring mixes everything evenly, so the spoonful reflects the entire pot.
Now imagine the salt has all sunk to the bottom and you scoop only from the top. Your spoonful will taste bland even if the soup overall is perfectly seasoned. The sample looks fine on the surface, but it does not match the pot in the characteristic you care about: saltiness. This is exactly the problem we want to avoid when we choose samples from real populations.
What "Representative" Means
A sample is representative when its makeup mirrors the population in the characteristics that are important to the question we are studying. In simple terms, a representative sample is a small version of the population that "looks like" the whole group in the ways that matter.
Consider a middle school with 600 students split evenly across grades 6, 7, and 8. If we want to estimate how many hours per week the entire student body spends on homework, a representative sample should include a fair share of students from each grade. A sample of 30 students drawn entirely from grade 8 would likely overstate the homework load, because older students often have more assignments.
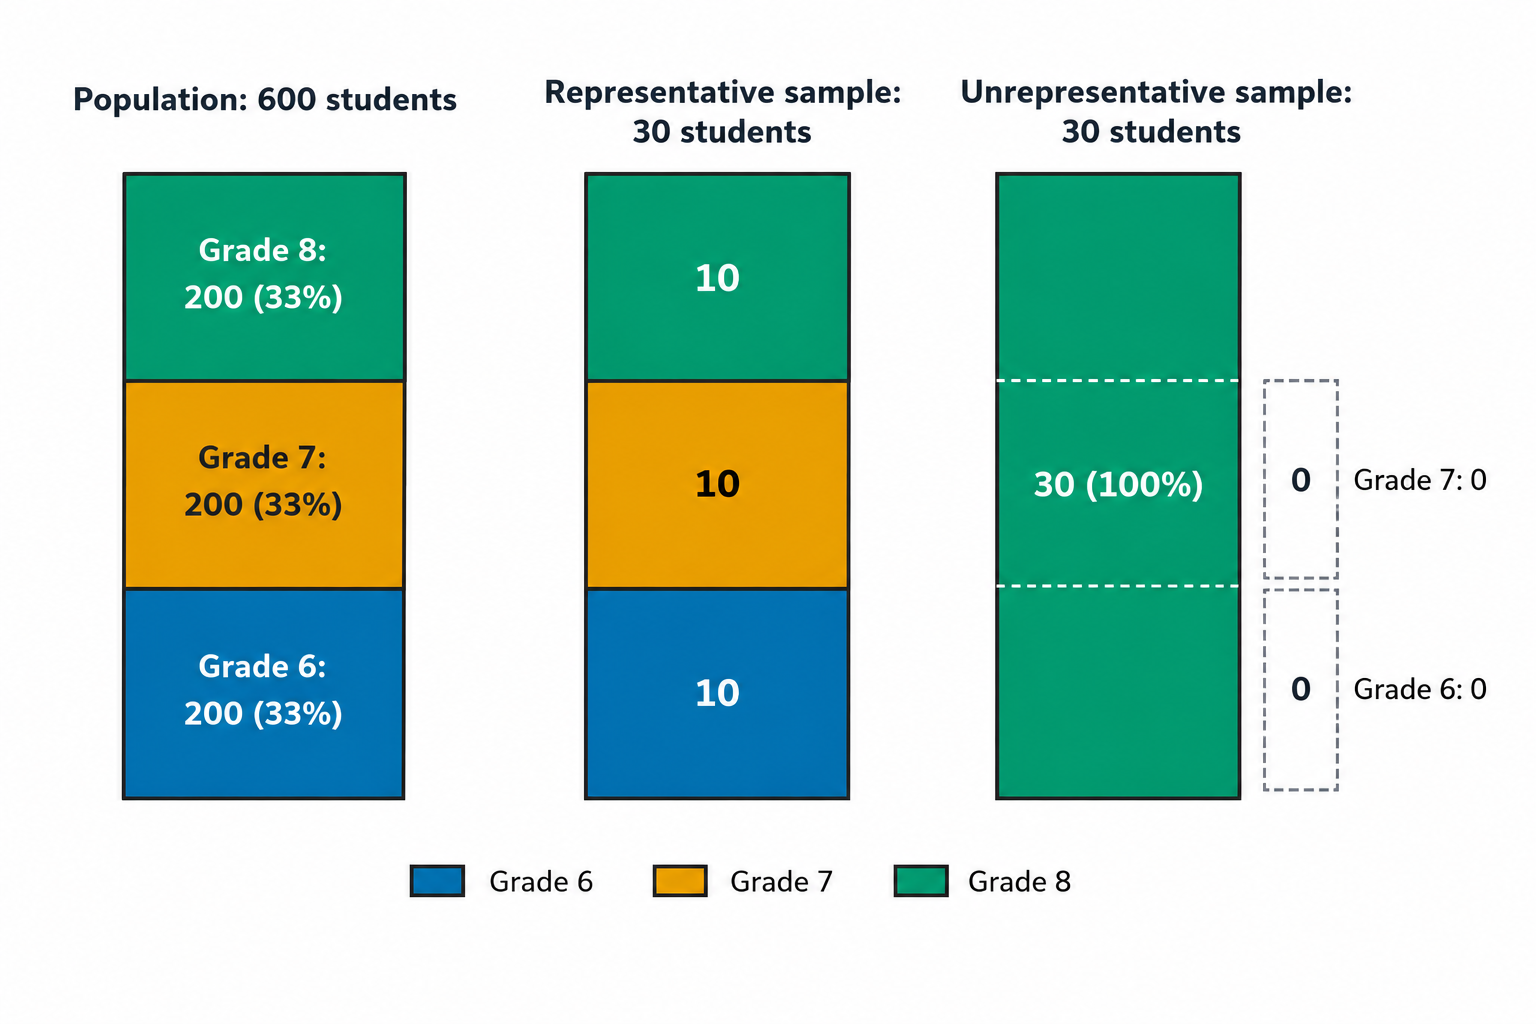
Notice the contrast in the figure above. When the sample includes students from all three grades in roughly equal shares, it mirrors the population. When it pulls only from grade 8, the picture it paints is skewed.
