Evaluating Evidence Strength
Introduction
Running a controlled evaluation is supposed to make model selection clear-cut, but real-world results are rarely that tidy: two models might post scores 0.07 apart after just a couple of runs, a model might average 0.92 while quietly failing the one case where failure actually matters, or a single dazzling run might look like proof of quality when it's really an outlier. Treating any of these as settled evidence is an overclaim, and the common failure mode is stopping at the first number that looks good instead of asking whether the evidence actually earns that conclusion.
You already know how to read runs, cases, metrics, and fair comparisons. This lesson brings those pieces together to answer one final question: is the evidence strong enough to act on? You'll learn to tell a strong result from a weak one using the same run and case signals you already know how to read, recognize the specific patterns that make evidence look more convincing than it is, and — when the evidence falls short — name the exact next test that would close the gap instead of shrugging or picking anyway. The habit to build: before accepting "Model X is better," ask what would have to be true for that conclusion to hold, and check whether it actually is.
Two Axes of Evidence Strength: Reliability and Coverage Revisited
You already know that runs measure reliability and cases measure coverage. Here, both ideas get reused as a test for evidence strength rather than just a reading habit: a score gap backed by only a couple of runs is weak reliability evidence even if the mean looks decisive, and a score backed by a narrow set of cases is weak coverage evidence even if it's high. The question to ask of any comparison is: would this conclusion survive a few more runs, or a few more realistic cases? If the answer is uncertain, the evidence isn't strong enough yet to lean on alone.
Consider a customer-support ticket-triage assistant that sorts incoming tickets into Billing, Technical, Escalate, or General. Two candidate models are compared with only 2 runs each:
| Model | Run 1 | Run 2 | Mean |
|---|---|---|---|
| Model R | 0.85 | 0.95 | (0.85+0.95)/2 = 1.80/2 = 0.90 |
| Model S | 0.80 | 0.86 | (0.80+0.86)/2 = 1.66/2 = 0.83 |
A 0.07 gap after two runs each is exactly the kind of number that could flip with a third run — too little reliability evidence to declare a winner yet. Now suppose the same two models are run 5 times each instead:
| Model | Runs | Mean |
|---|---|---|
| Model R | 0.85, 0.95, 0.88, 0.91, 0.89 | 4.48/5 = 0.90 |
| Model S | 0.80, 0.86, 0.82, 0.84, 0.83 | 4.15/5 = 0.83 |
The gap is still about 0.07, but now it holds steady across five runs instead of two. That repetition is what turns a suspicious number into credible signal — the score itself didn't change, but your confidence in it should.
Knowing that more runs and more cases strengthen evidence is the foundation. But even careful readers get fooled by specific patterns that look like strong evidence at a glance, and naming those patterns is the next skill.
Four Patterns That Separate Signal from Overclaim
Four recurring patterns show up constantly in evaluation results, and telling them apart is the core reading skill this unit builds:
- Small gap, few runs — a narrow lead that hasn't been tested enough to rule out noise.
- Single unusually strong run — one great score standing in for a model's typical behavior, when the other runs tell a different story.
- Higher aggregate score with a critical-case failure — the average looks best, but it's hiding a miss on a case where being wrong carries outsized real-world cost.
- Stable, repeated results across representative cases — the one pattern that actually counts as strong evidence, because it survived both a reliability check and a coverage check.
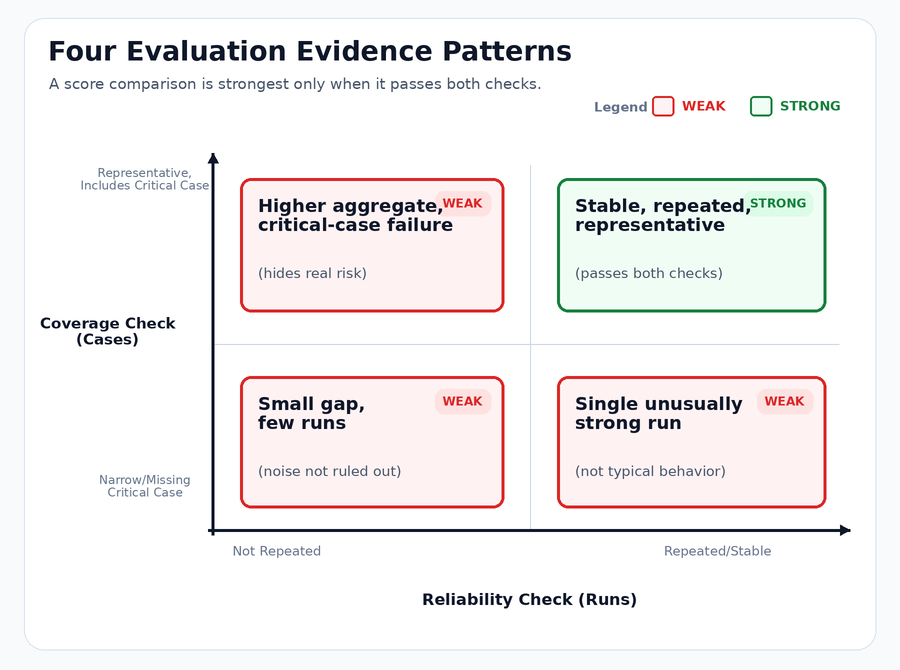
Before trusting any conclusion, run it through this checklist:
- Enough runs? Was the gap tested across enough runs to rule out noise?
- Repeated or one-off? Did the strong result show up more than once, or just a single time?
- Critical case checked? Does the aggregate hide a failure on the one case where being wrong costs the most?
- Representative cases? Does the case set include the risky, real-world inputs, not just the easy ones?
Return to ticket triage, now with three runs each and a look at case-level detail:
| Model | Run 1 | Run 2 | Run 3 | Mean |
|---|---|---|---|---|
| Model T | 0.91 | 0.93 | 0.92 | 2.76/3 = 0.92 |
| Model U | 0.86 | 0.88 | 0.87 | 2.61/3 = 0.87 |
Model T has the higher, stable mean. But suppose Case details shows one ticket in the set reads: "I'm contacting my lawyer about this billing error," labeled Escalate. Model T classified it as Billing in all 3 runs; Model U classified it correctly as Escalate in all 3 runs. Model T's 0.05 mean advantage doesn't offset a consistent miss on the one case where a wrong answer means a real legal complaint goes unflagged.
Separately, imagine Model N runs at 0.80, 0.98, 0.82 (mean 2.60/3 = 0.87). Anyone who only saw the 0.98 run would assume excellence — the other two runs show that score was the exception, not the rule.
These patterns aren't just something to spot in a report someone hands you. They show up the moment you run a live comparison yourself, which is exactly the next skill.
Comparison in Real Practice
This course path is an introduction to LLM evaluation. We have seen how evaluation works in general: define a task, hold the conditions steady, run the models, and interpret the results.
Real-world prompt evaluation follows the same principles, but it requires wider test sets and heavier statistical analysis. To compare two models in practice, we should:
- Create a representative test set that is large enough for the decision.
- Follow the controlled-evaluation principles described throughout this course path.
- Avoid deciding from a simple number comparison such as “mean A > mean B, so A is better.” Use statistical analysis, including a statistical test to determine whether the difference between the means is statistically significant.
Conclusion
The shift this unit builds is moving from "which score is higher" to "how much can this evidence actually support, and what haven't I tested yet." A mean by itself never answers that question — it takes checking run-to-run consistency, checking whether the case that matters most actually passed, and naming what the case set still doesn't cover.
Carry it forward as a four-part check: Was it repeated? Was it representative? Did it hold on the critical case? Was every hard requirement actually tested? When all four hold, you have grounds to choose. When any one doesn't, you have your next test, not a shrug.
The practices ahead put this exact sequence to work: judging which conclusions a set of short evaluation scenarios actually justify, running your own two-model comparison in the simulator and reading Results, Case details, and score distribution without assuming a winner going in, working through a fixed evaluation report to spot a hidden critical-case failure and name the uncertainty that remains, and finally turning evidence — sufficient or not — into the right next decision instead of a guess.
