After tracking your assumptions and testing for bias, the next step is to systematically account for risks that could derail your business case. The HBR Guide to Building Your Business Case by Raymond Sheen stresses that while you can’t predict the future, stakeholders expect you to have considered what could go wrong—and what could go right. Most managers treat risk analysis as an afterthought, but this leaves you open to tough “What if?” questions. Instead, you’ll learn to identify and focus on the most important risks, using your organization’s real experience as a guide.
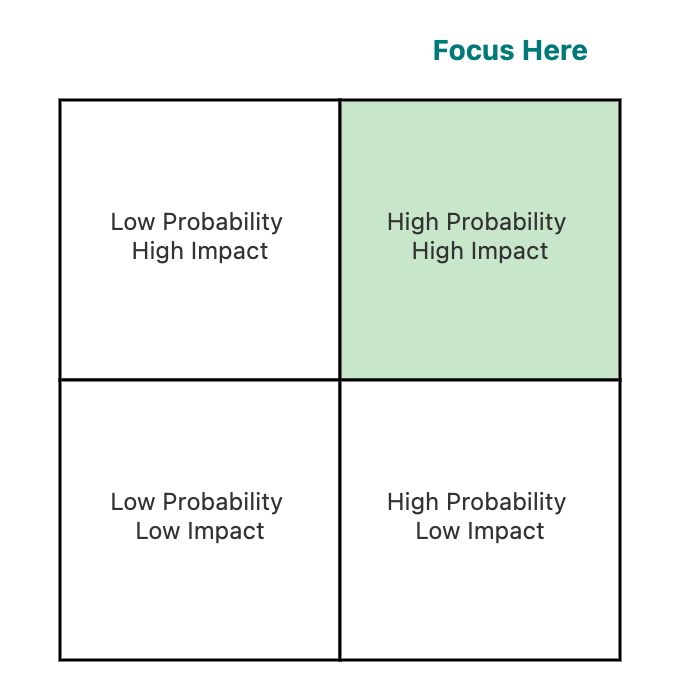
Using a simple probability-impact matrix, a 2x2 grid with probability on one axis and impact on the other, helps you prioritize risks. Focus on those in the upper-right quadrant: high probability and high impact (highlighted in green). This approach prevents you from being overwhelmed by long lists of risks and makes it easy for stakeholders to see your priorities.
For probability, use your organization’s actual track record. For example, if vendors have delivered late 60% of the time, use that as your estimate. The HBR Guide shares an example of a medical device company that revised its regulatory delay probability from 10% to 45% after checking real FDA timelines, which changed their whole plan.
For impact, quantify in dollar terms whenever possible. Instead of “high impact,” say “a three-month delay would cost $1 million.” In one facilities project, a $3 million environmental risk with 15% probability was prioritized over many smaller risks.
The matrix also helps reveal risk clusters and dependencies. The guide describes an ERP project where several risks traced back to poor legacy documentation, so the team focused on fixing that root cause.
Once you have identified key risks, the next step is to model two common scenarios such as a six-month delay and a 20% cost overrun. These are typical variances in real projects, and modeling them demonstrates to stakeholders that you have carefully considered their potential impact.
For example, a product launch with an NPV of $4.2 million dropped to negative $300,000 when a six-month delay was modeled, due to higher costs and lost revenue from missing the holiday season.
Cost overruns rarely hit all categories equally. Consider this conversation between two team members working through a risk analysis:
- Victoria: I've modeled the 20% overrun—we just multiply all our costs by 1.2, right?
- Dan: That’s not how overruns actually happen. Look at our last three projects, consulting fees went 45% over, internal time doubled, but licenses stayed on budget.
- Victoria: So if I model it that way...
- Dan: Your consulting jumps from $2M to $2.9M, internal from $1.5M to $3M. That’s not a 20% overrun overall, it’s 35% in the risky areas.
- Victoria: That pushes our NPV negative. We’d need fixed-price contracts for consulting.
- Dan: Now you’re thinking like someone who’s been through this before.
This conversation demonstrates the importance of digging into real project data, challenging assumptions, and collaborating to model risks more accurately. Dan’s pushback helped Victoria move beyond a simple, blanket assumption and instead focus on the categories that historically run over budget. This approach not only leads to more realistic risk modeling, but also builds credibility with stakeholders by showing you have learned from past experience and can anticipate where problems are most likely to occur.
Be sure you are modeling best case, likely case, and worst case scenarios, and combining risks to see which combinations are truly dangerous. One tech company found their project could survive a 30% overrun or a nine-month delay, but not both together, so they set up go/no-go checkpoints. By asking clarifying questions and sharing specific examples, you can uncover where overruns are most likely and adjust your analysis accordingly.
Your risk analysis should match your organization’s risk appetite and history. A startup and a utility company will use the same numbers to make very different decisions. Sometimes, leaders on the same team have different tolerances. One pharma company’s CEO wanted aggressive goals, while the CFO wanted conservative ones. The solution: use aggressive numbers for stretch goals, but conservative ones for board commitments.
Look at your organization’s recent projects. Project archaeology, reviewing the last five to ten similar initiatives, can reveal important patterns. For example, a retail chain found all store renovations went over budget due to structural surprises, so they added a 25% contingency for that risk in future proposals.
A software company learned from three past modernization projects. Two failed with “big bang” launches, one succeeded with a phased approach. For the next project, they proposed smaller phases and more checkpoints, and adjusted all assumptions based on past lessons. The committee approved it because it showed real learning.
In the upcoming role-play exercises, you will practice building probability-impact matrices, modeling delay and overrun scenarios, and calibrating your assumptions to match both leadership risk tolerance and organizational experience. This will help you present risk analysis that builds confidence, not fear.
