In this unit, you’ll learn how to transition from spotting patterns to making high-stakes business decisions. Having mastered how to identify biases and nonlinear trends in the previous lesson, you must now apply that "clean" data to drive organizational change. Drawing from the structured approaches in the HBR Guide to Data Analytics Basics for Managers, you will learn to synthesize your findings into a decision framework that moves beyond observation and into execution.
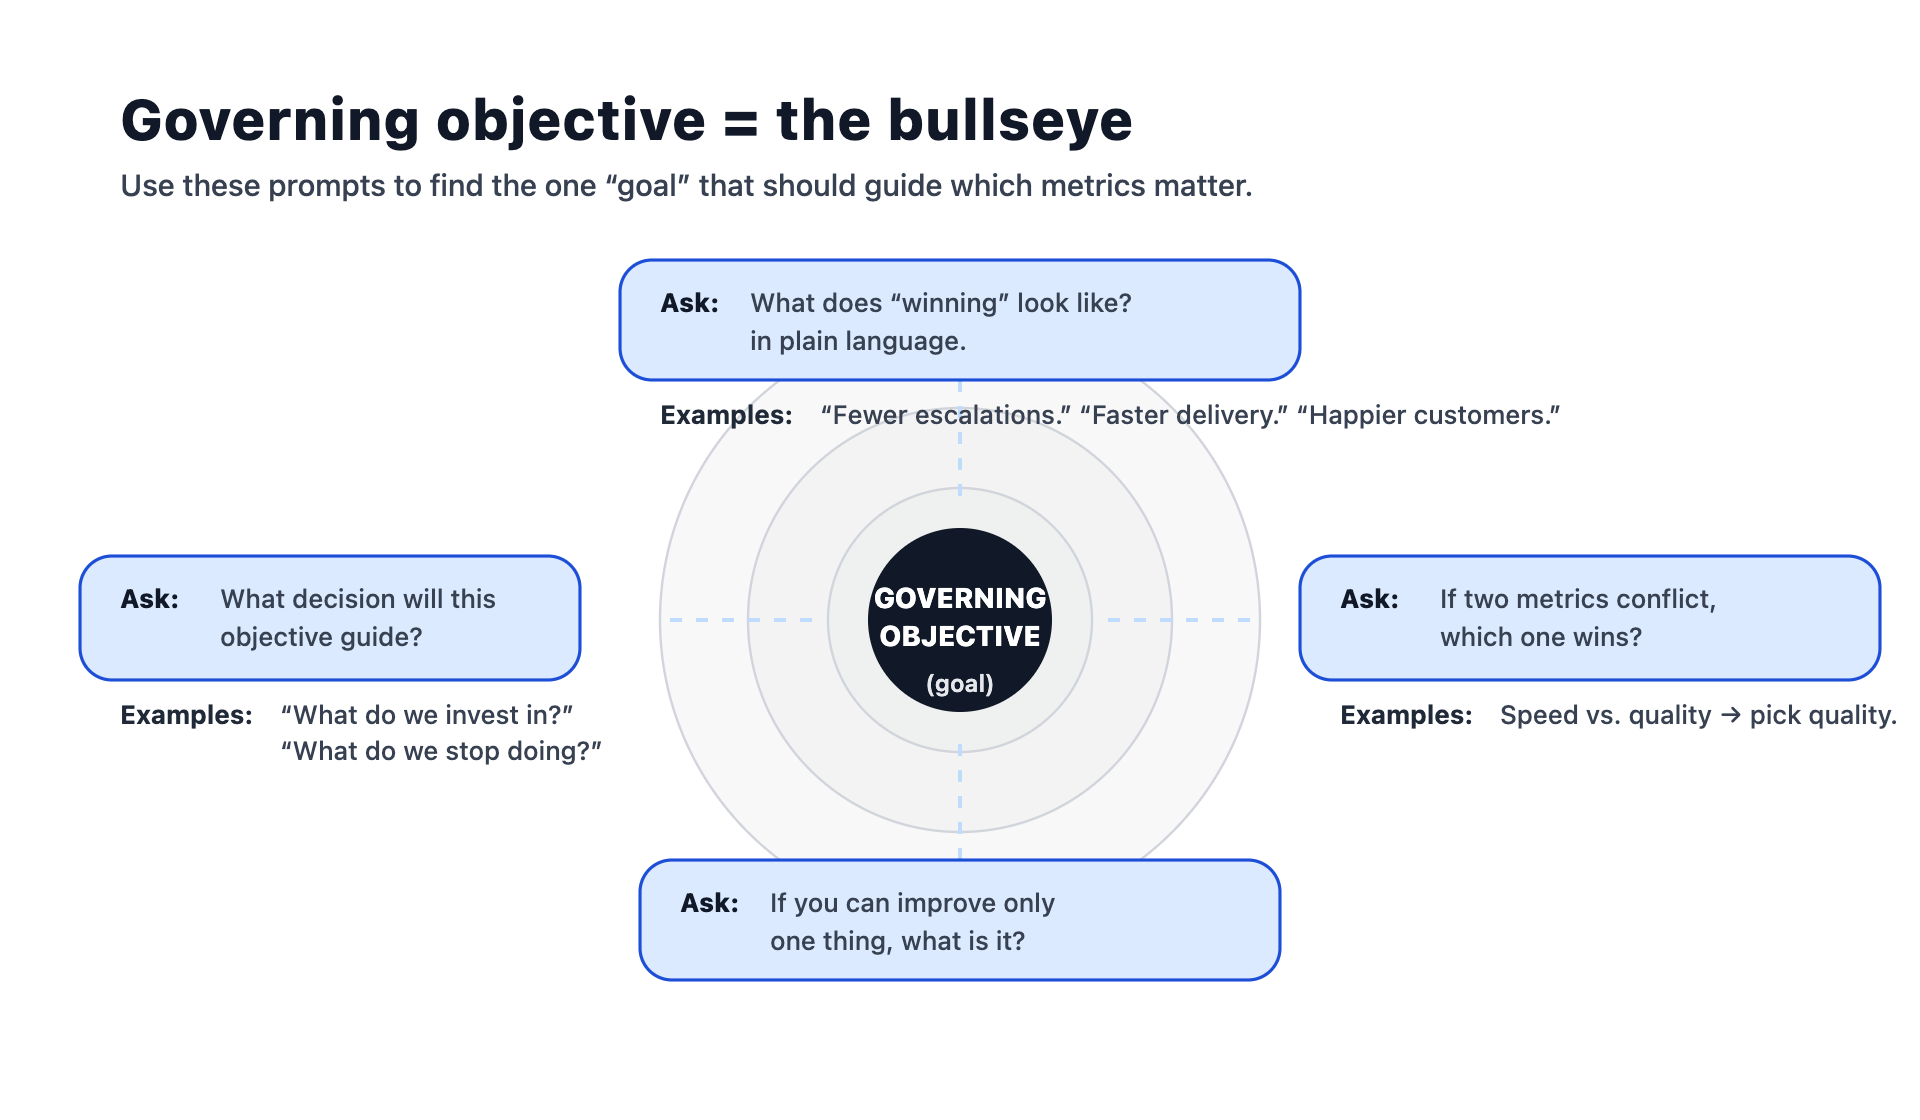
Once you have stripped away the "noise" of biases like the confirmation trap, the next step is to align your remaining data with a governing objective. A governing objective is the core target that dictates which metrics actually matter. Think of the governing objective as the "bullseye" that centers your analysis process:
To move from analysis to action, you must refine your findings into two or three distinct, mutually exclusive alternatives. For each potential choice, ask: "Does this directly serve our governing objective?" While the previous lesson taught you to identify "vanity metrics" to avoid being misled, this stage requires you to aggressively discard them so they don't clutter your decision-making process. For example, if your objective is profit, a high-engagement social media post is only relevant if the data shows a predictive link to sales. If the link is weak, that metric should be excluded from the final decision deck. Every insight you present must be a "lever" that a manager can actually pull.
When presenting your final options, you must account for the confidence and risk trade-off. This involves evaluating the frequency of the correlation you've found and the clarity of what is causing it. Even if you have identified a strong trend, you must weigh the benefit of acting against the "cost of being wrong."
A powerful way to apply this is by looking for asymmetric opportunities—situations where the potential upside of an action is high, but the cost of failure is relatively low. For instance, asking "What is the biggest risk here?" at the end of a meeting is an asymmetric opportunity: the "cost" is 30 seconds of conversation, while the potential upside is catching a mistake that could have cost the company thousands of dollars. This is where the "pre-mortem" exercise from the previous unit becomes a practical tool for risk mitigation: by imagining a failure in the future, you can identify which of your current assumptions is the most fragile. If a decision relies on a correlation where it’s unclear whether one factor is actually causing the change in another, you should treat it as a high-risk path.
Here is a dialogue demonstrating the move from analyzing a trend to committing to a specific path:
- Nova: Our analysis filtered out the viral outliers from last month. The core data shows a 5% steady increase in referrals, but the acquisition cost is slightly over budget.
- Victoria: Given our governing objective is to maximize profit this quarter, what are the actionable paths?
- Nova: We can either tighten the referral criteria to lower costs, which might slow growth, or we can maintain the current spend for another month to see if the customer lifetime value offsets the initial cost.
- Victoria: What’s the risk if we're wrong about the lifetime value?
- Nova: It’s an asymmetric risk. If we're right, we scale a high-profit channel. If we're wrong, we lose $2,000 in test budget—a cost we can absorb without missing our quarterly target.
- Victoria: Since the cost of being wrong is low compared to the potential upside, let's move forward with the second option and review the data in 30 days.
A major pitfall in the final stage of analysis is the "paralysis of more data." To avoid this, you must evaluate whether additional information will actually change your decision. If the cost of delaying action is higher than the risk of moving forward with current uncertainties, it is time to execute.
This is where understanding leverage is key. You should look for areas where a small improvement leads to a disproportionate impact on the governing objective. This is a concept often found in the nonlinear relationships discussed previously. If your analysis points to a clear point of leverage, further study often yields diminishing returns. Instead of requesting another week of data, propose a small-scale "business experiment" or A/B test. This allows you to learn from real-world outcomes rather than theoretical models. By shifting the focus from "perfect certainty" to "informed action," you ensure that your data analysis results in a tangible business impact. In the upcoming practices, you will have the chance to put these principles into practice, synthesizing complex data findings into a clear, actionable recommendation for a business stakeholder.
