In this unit, you’ll begin your journey into business analytics by building a practical foundation—one that doesn’t require advanced math or technical jargon. The ideas here are drawn from the HBR Guide to Data Analytics Basics for Managers and will help you become a more confident, evidence-driven decision maker.
As you progress through this course, you’ll learn how to interpret data, question assumptions, avoid common analytical traps, and—most importantly—turn analysis into clear business action. You’ll also get hands-on practice through quizzes, writing, and roleplay scenarios designed to help you bridge the gap between technical experts and business stakeholders.
Understanding the three main types of analysis is essential for any manager:
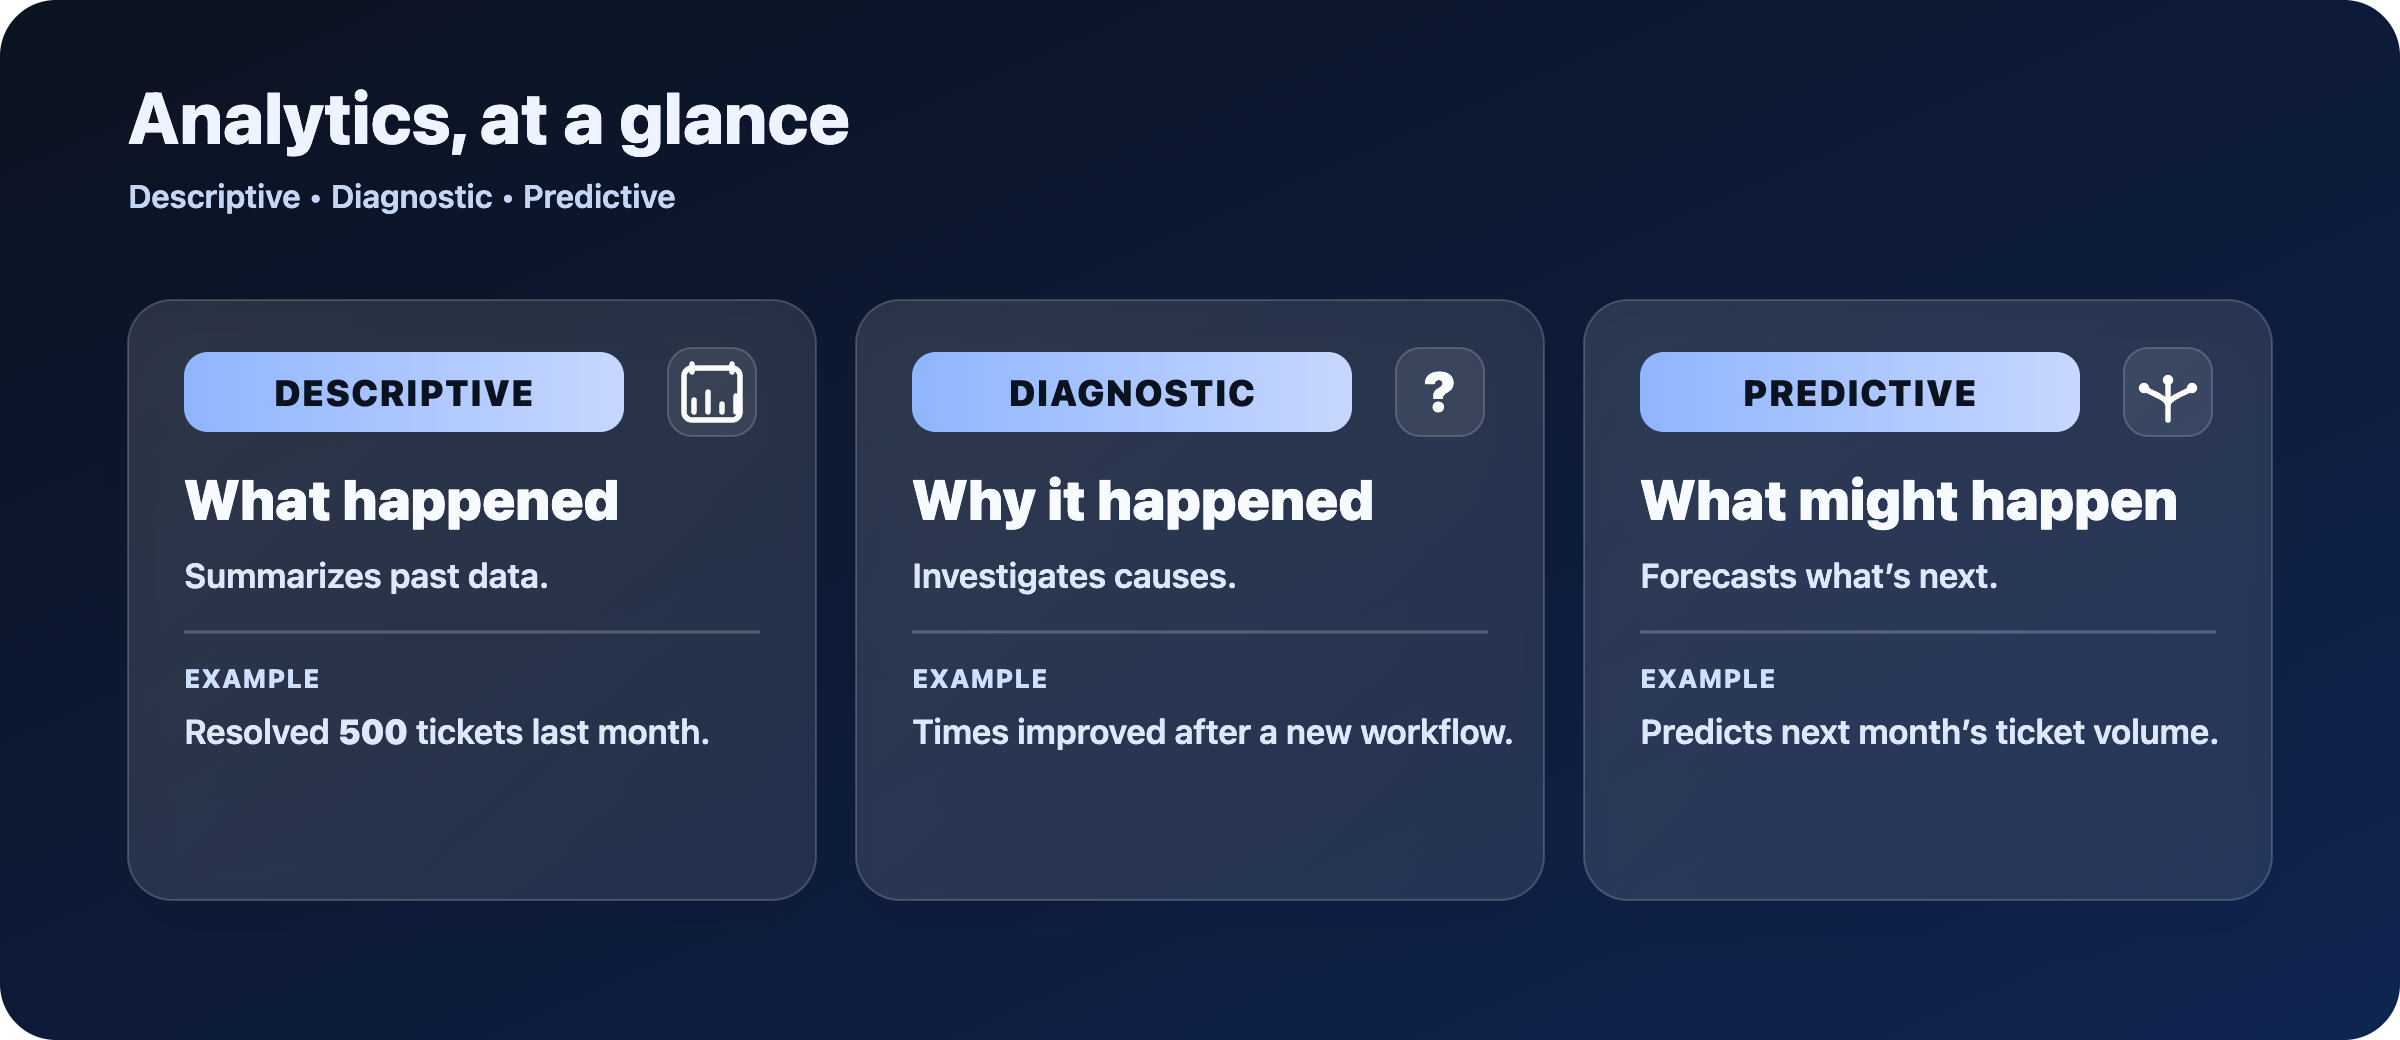
Knowing which type of analysis you’re looking at helps you ask better questions and set realistic expectations for what the data can (and can’t) tell you.
Three foundational concepts appear again and again in business analytics:
Correlation measures how two things move together, but does not prove that one causes the other. For instance, "Sales of sunscreen and ice cream both rise in summer, but buying sunscreen doesn’t cause people to buy ice cream."
Regression is a tool for estimating how much one or more factors influence an outcome. You might use regression to answer, "If we increase our marketing budget by $10,000, how much will sales likely increase?" You don’t need to know the math—just that regression helps you predict and explain relationships.
Statistical significance helps you judge whether a result is likely real or just due to random chance. If a new product feature increases user engagement by 3%, but the difference isn’t statistically significant, it might just be luck. A good question to ask is, "Is this result strong enough that we should act on it, or could it be random?"
You don’t need to run these calculations yourself, but you should feel comfortable asking for plain-language explanations and summaries.
To see these concepts in action, consider this conversation between Chris, a marketing manager, and Natalie, a data analyst, as they review a recent ad campaign report:
- Chris: Hey Natalie, I saw your report says our new ad campaign is correlated with higher sales. Does that mean the ads caused the increase?
- Natalie: Good question, Chris. Not necessarily—correlation just means they moved together. It could be the ads, or maybe something else, like seasonality.
- Chris: Got it. I also noticed you mentioned regression analysis. Can you explain what that tells us?
- Natalie: Sure! Regression helps us estimate how much the ad spend might be influencing sales, while accounting for other factors. For example, it suggests that for every extra $1,000 we spend, sales go up by about $2,500, holding other things constant.
- Chris: And what about significance? How do we know this isn’t just a fluke?
- Natalie: The results are statistically significant, which means it’s unlikely the sales jump happened by chance. But we should still be cautious and look for other explanations, just in case.
In this exchange, Natalie demonstrates how to clarify the difference between correlation and causation, explain regression in plain language, and address the importance of statistical significance. By summarizing complex findings into business-relevant insights, she ensures that the data leads to an informed decision rather than confusion.
Not every business question needs a complex model. Advanced analytics—like machine learning or multi-factor regressions—are most useful when the stakes are high, the data is large or messy, or when simple summaries can’t answer the question. For many day-to-day decisions, simple descriptive or diagnostic analysis is enough. If you ever feel lost in technical detail, it’s perfectly reasonable to ask, "Can you explain what this means for our decision in one or two sentences?"
By mastering these core concepts, you’ll be able to cut through jargon, ask sharper questions, and make more confident, data-informed decisions. Up next, you’ll get to practice these ideas in a roleplay where you’ll translate technical explanations into clear, actionable business language.
