Welcome to the first lesson of the course "Scoring LLM Outputs with Logprobs and Perplexity." In this lesson, we will explore the concept of log probabilities in language models. Log probabilities help measure how likely a model considers each possible next word or token given a specific prompt. This internal signal is essential for understanding how models like GPT-3.5 make predictions and how confident they are about each token.
By the end of this lesson, you will be able to extract and interpret log probabilities from a model’s response and get a deeper look into how it evaluates different word choices.
To follow along, ensure you have the OpenAI library installed. If you're using your local environment, run:
If you're working inside the CodeSignal environment, the necessary libraries are already installed for you.
Let’s take a look at a code snippet that extracts log probabilities using OpenAI’s API. We’ll use a more open-ended prompt that can yield multiple possible completions. This gives us a better opportunity to inspect how confident the model is in its different predictions.
Notice that we set
max_tokens=1in the API call. This is essential because it tells the model to generate only a single token as output. By limiting the output to one token, we can clearly examine the log probabilities for just the immediate next token, making it much easier to interpret the model’s confidence and the alternatives at that specific position. If we allowed more tokens, the response would include log probabilities for each generated token in the sequence, which could make the analysis more complex and less focused for this introductory example.
Before iterating through the log probability data, it’s important to understand the structure of response.choices[0].logprobs.content. This object is a list, where each element corresponds to a generated token. Each element contains:
token: the generated token (e.g., "apple")top_logprobs: a list of the top alternative tokens and their log probabilities for that position. Each entry intop_logprobshas:token: the alternative tokenlogprob: the log probability assigned to that token
This structure allows you to see not only the token the model generated, but also the model’s confidence in the top alternative tokens at that position.
Once the model responds, we inspect the returned token and its associated alternatives. Each alternative token is associated with a log probability, which represents the model’s confidence. Log probabilities are typically negative, with values closer to zero indicating higher confidence. The more negative the log probability, the less likely the model considers that token as the next word.
For example, you may see:
In this example, "apple" has the highest confidence with a log probability of -0.018, making it the most likely token. "Banana" follows with a log probability of -0.576, indicating it is less likely than "apple" but more likely than "orange", "grapes", and "fruit". Understanding these values helps in assessing the model's prediction confidence and the relative likelihood of different tokens.
To better understand the relationship between log probabilities and probabilities, you can visualize both for the top tokens using a simple plot. This helps you see how a small difference in log probability can correspond to a much larger difference in actual probability.
The output plot look like this:
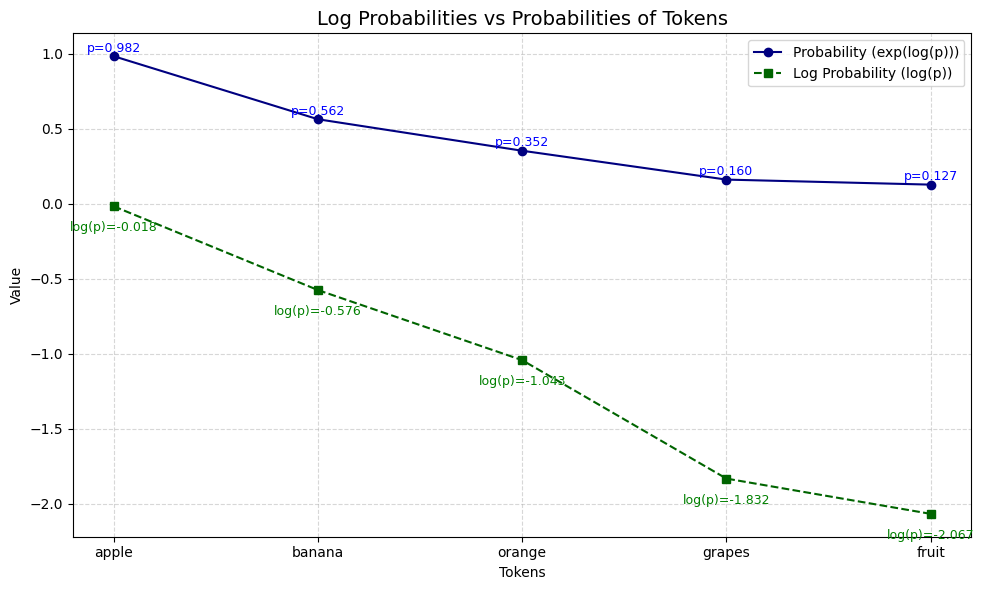
This plot shows:
- The log probability for each token (dashed green line)
- The corresponding probability (solid blue line)
- Value annotations for both log probability and probability
Notice how the token with the log probability closest to zero ("apple") also has the highest probability, and how the differences in log probability translate to much larger differences in actual probability. This visualization can help you build intuition for interpreting log probabilities in practice.
In this lesson, you learned what log probabilities are, how to retrieve them using the OpenAI API, and how to interpret them in practice. This technique is useful for gaining deeper insight into model behavior and understanding how confident it is in its generated outputs.
In the next lesson, we’ll build on this by using log probabilities to compare sentence likelihoods — giving us a tool for scoring how "natural" different sentences sound to a language model.
Stay curious and experiment with different prompts to see how token predictions vary!
