Reading Evaluation Results
Introduction
A single average can feel like proof. You run an evaluation, see 0.85, and it is tempting to treat that number as a verdict on the prompt. But your previous work showed how a metric turns a model output into a score, and one score — or one average of scores — does not tell you whether the result would hold up if you ran it again tomorrow. The practical question is not whether one number looks high in isolation. It is whether the result is steady enough, and based on enough evidence, to support a beginner decision about a prompt.
Here you will read the average result, check whether repeated runs behave similarly, find the correct value in the evaluation report, and turn that evidence into a cautious ship, revise, or need more cases recommendation. The habit you should walk away with is asking two questions of every result instead of one. That starts with separating two ideas a single average tends to blur together.
Mean Versus Consistency
The mean is the average of the scores in an evaluation. With a 0/1 metric, suppose four cases receive scores of 1, 1, 1, and 0. The mean is 0.75. That tells you three of the four case checks passed in that view of the result. It does not tell you the prompt will pass every future case.
Consistency means repeated runs under the same conditions produce similar results. Keep the prompt, cases, metric, model, and run settings fixed when you repeat the evaluation. If the run means are 0.75, 0.75, and 0.75, the result looks stable. If they are 1.00, 0.50, and 1.00, the overall mean may still look high, but the prompt is less predictable.
It is important not to confuse runs with cases. Run means compare repeats of the same evaluation, not different countries or inputs. Different cases are about coverage; they are not the same thing as run-to-run consistency.
A high mean with stable runs is stronger evidence than a high mean from one lucky run. Also inspect case-level scores and outputs. A prompt may have a good average while repeatedly failing one important factual case. A low mean can sometimes reflect a metric that is too strict, as you saw earlier. The number only becomes useful when you read it alongside the output and the quality bar.
Ask both questions: “How well did it score?” and “How reliably did it score that way?”
When the Scores Do Not Match
Not every evaluation looks like several equal run means. Sometimes the overall mean still looks acceptable, but the repeated runs disagree.
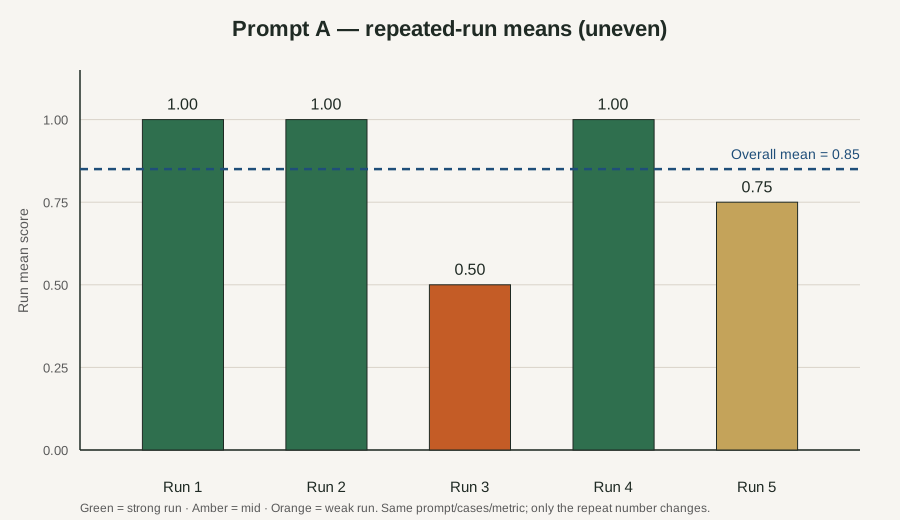
In this chart, Prompt A’s overall mean is 0.85. At first glance that can look strong. The bars tell a different story: most repeats are high, but Run 3 drops to 0.50 and Run 5 sits at 0.75. The average hides that unevenness.
For a beginner factual prompt, that pattern usually means do not ship yet. A cautious call is revise after inspecting the weak run’s Case details—or need more cases if you cannot tell whether the drop is a one-off. Keep the prompt, cases, metric, and run settings fixed while you investigate. Change only what the evidence points to.
Keep this habit:
- Similar run means → the overall mean is more trustworthy
- Uneven run means → the overall mean alone is not enough; lean revise or inspect before shipping
Read the Evaluation Report
Once you understand the result, use the evaluation report in the evaluator to read the evidence accurately. After a run, look at the report and start by identifying the correct prompt, then locate its overall mean.
Do not accidentally copy a single case score or the mean from only one repeat. If the report labels a value as Prompt A’s overall mean, that is the value to use. If the summary uses a 0-to-1 scale, a value of 0.75 represents 75% on that scale. If it uses percentages directly, record the percentage shown. Follow the format in the report instead of converting the value without evidence.
Read the mean together with the nearby context:
- Which metric was used — a low mean can reflect a strict metric rather than a weak prompt.
- How many runs were included — one repeat cannot show you consistency.
- Whether the case-level results reveal a repeated miss — the same case failing every run is a different problem than a scattered miss.
This prevents a common mistake: reporting a precise number while losing the conditions that give the number meaning. Once you can read the evidence correctly, you can use it to make an actual call.
Make a Beginner Gate Call
A beginner gate call is a practical recommendation based on the evidence you have. It is not a claim that the prompt is perfect. To make a call, you must first establish a quality bar. In a professional setting, this threshold is set by the business requirements.
For the practices in this course, we will use the following guidelines for a "strong" result:
- Overall Mean: 0.90 (90%) or higher.
- Consistency: Run-to-run variation of 0.10 or less.
- Case Integrity: No "0" scores on important or "must-pass" cases.
With that bar in place, every result maps onto one of three recommendations.
The Three Recommendations
- Ship means the mean meets the quality bar (e.g., 0.90+), repeated runs are stable, and no important case shows an obvious failure.
- Revise means the result is below the required bar, or the same case fails in a way that points to a prompt or evaluation problem. Before revising the prompt, check that the expected answer and metric actually match the job. If an acceptable sentence failed only because Exact Match was too strict, changing the prompt would treat a measurement problem as a model problem.
- Need more cases means the current result is promising but too small or too limited to support a confident call. This fits when the runs are stable but the cases cover only an easy path. It can also fit a mixed result where you cannot tell whether one miss is isolated or recurring.
Example: if a report showed an overall mean of 0.75 and repeated run means of 1.00, 1.00, and 0.50, a reasonable recommendation might be: “I recommend revising rather than shipping. Prompt A’s overall mean is 0.75, which is below our 0.90 threshold, and its repeated runs vary significantly from 1.00 to 0.50. I would inspect the low run and rerun before treating the prompt as reliable.” Your own recommendation should use the values and outputs in the simulator or chart you are given, not invented evidence.
Conclusion
The shift in thinking is small but decisive: a score is not a verdict. A mean tells you how well a prompt did in one view of the result, and consistency tells you how much you can trust that view. Reading only the first number is how a lucky run gets shipped.
Compressed into a working habit: identify the right prompt in the report, read its overall mean, check whether the repeated runs agree, scan the case-level results for a repeated miss, then compare all of that against the quality bar before naming ship, revise, or need more cases. Similar run means make the average more trustworthy; uneven run means mean the average alone is not enough.
In the practice that follows, you will apply this habit to real evaluation reports and charts — locating the overall mean, judging consistency, and writing a cautious recommendation that cites the values you actually see.
