Summarizing Data with Aggregates
Introduction
Welcome to Summarizing Data. We’re beginning the first lesson in this course, building on the array skills from earlier courses. After using vectorized operations to transform every value at once, we can ask a new question: what can the whole array tell us? We’ll use aggregate functions to find totals, averages, extremes, and spread. Each function turns an array into a single useful number, helping us describe data without writing a loop.
Totals and Averages with np.sum and np.mean
An aggregate function takes many array values and summarizes them with one result. Let’s start with exam scores. As you may recall from earlier lessons, NumPy arrays have a shared dtype. For this integer array, np.sum returns an integer result, while np.mean returns a floating-point result. That makes sense for an average, which can fall between whole numbers, and connects to /, which produces floats. As always, we import NumPy as np first; the later snippets in this lesson use the same import.
np.sum(scores) adds every score; np.mean(scores) calculates their average. Printing each result’s dtype lets us see the type of the single value that each call returns. The output is:
The exact integer type depends on your platform (some systems print int32 instead of int64), but the pattern is the same everywhere: the total is an integer, and the average is a float64.
Finding Extremes with np.min and np.max
A total or average describes the overall level of a dataset, but sometimes we want its endpoints. For daily rainfall, np.min finds the smallest amount, and np.max finds the largest. Each call returns one number, so together they give us a quick view of the data’s range, from driest to wettest.
Here, the first printed value is the driest day’s rainfall, and the second is the wettest day’s. The output is:
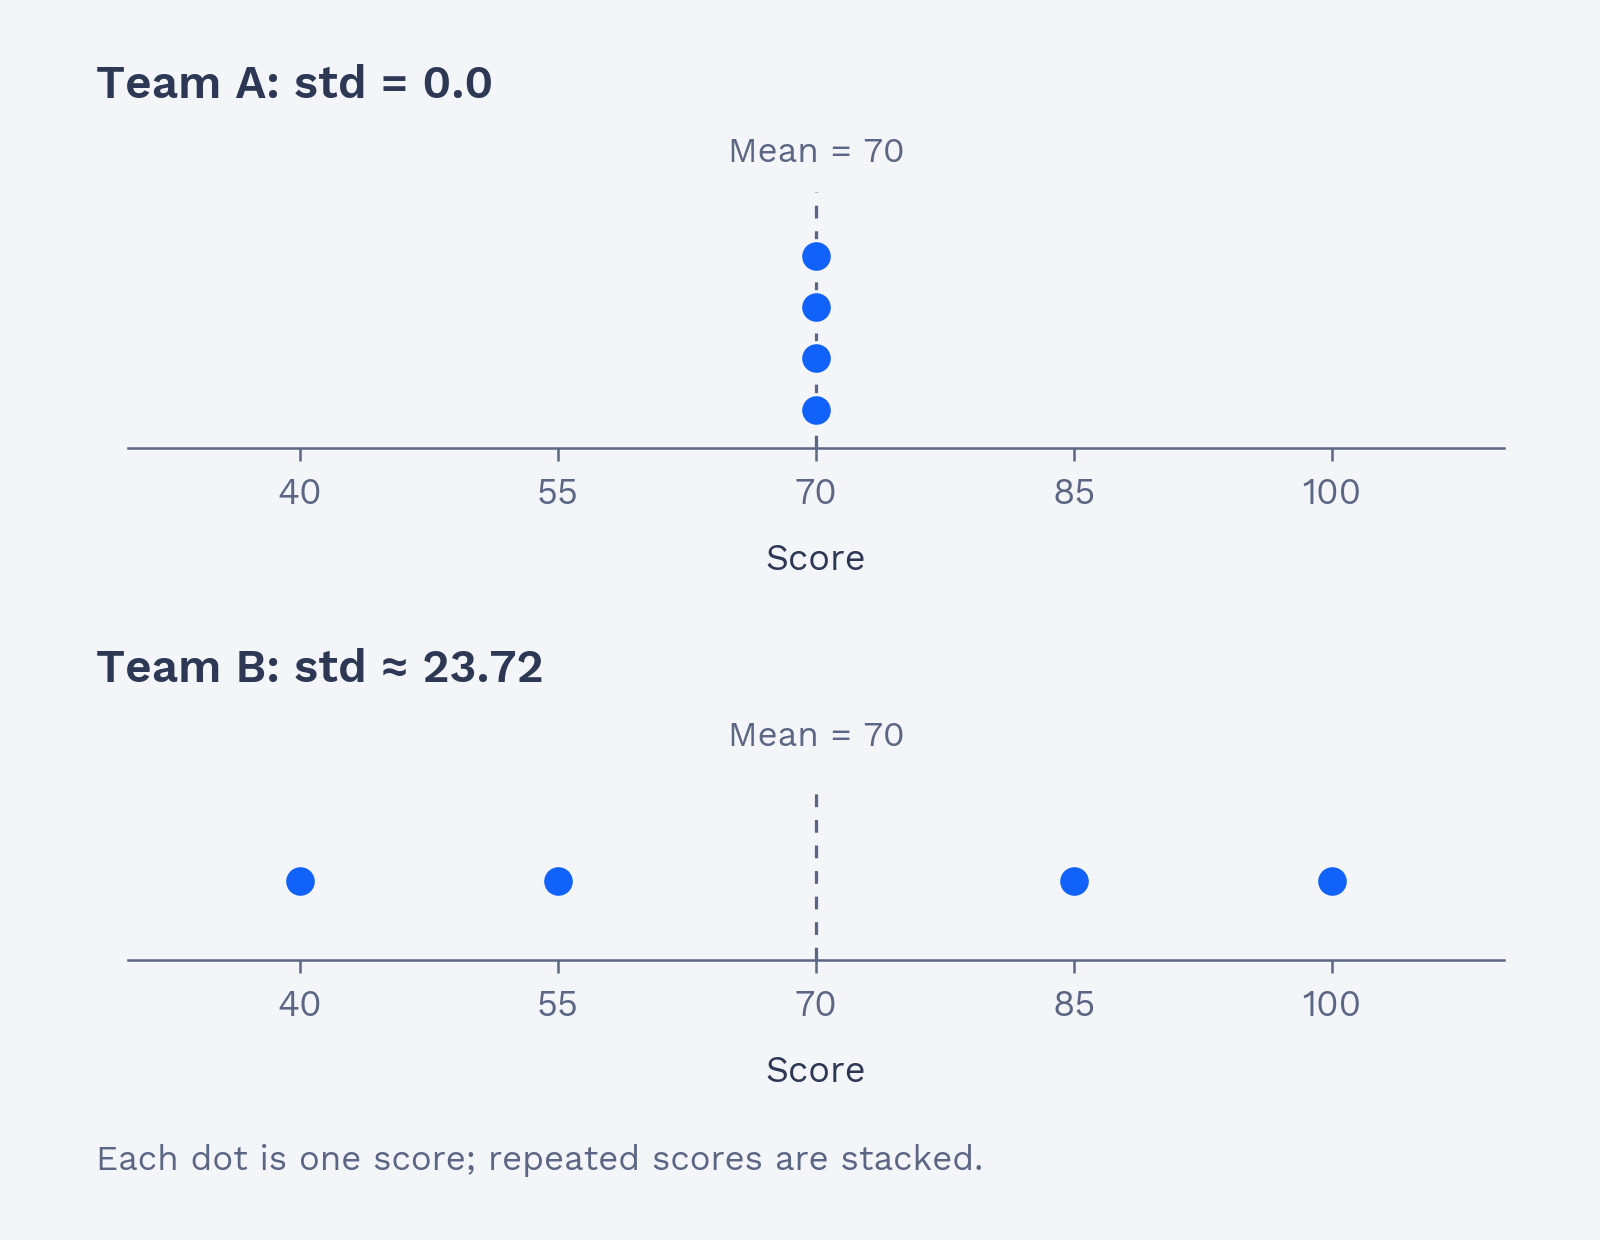
Measuring Spread: Why the Mean Alone Isn’t Enough