Welcome back to Solving Compound Inequalities! You are now on the fifth of six lessons, which means you are almost at the finish line for this course. Over the previous four lessons, you learned to distinguish "and" from "or," solved both types of compound inequalities, and streamlined bounded solutions using three-part chains.
Along the way, number-line visuals appeared to illustrate results — but we never paused to study how those graphs are built from scratch. This lesson puts the number line front and center.
You will learn exactly how to graph compound solutions by choosing the correct endpoint style and drawing the correct shape — whether that is a single bounded segment or two separated rays.
Two Shapes, Two Meanings
The logical difference between "and" and "or" produces two visually distinct shapes on the number line. Recognizing this connection before you pick up a pencil makes graphing much faster.
An "and" solution usually appears as a single bounded segment — a finite stretch between two boundary values where both conditions are satisfied.
An "or" solution usually appears as two separated rays — one extending to the left and one to the right, with a gap of excluded values in between.
Think of it this way: "and" squeezes the solution into a window, so the shading stays between the boundaries. "Or" pushes the solution outward, so the shading moves away from the boundaries in both directions. Once you know which connective the compound inequality uses, you already know the overall shape before drawing a single mark.
Graphing "And" Solutions: The Bounded Segment
An "and" compound inequality produces a solution set where the variable is trapped between two boundary values. Consider the solved result:
2≤x<7
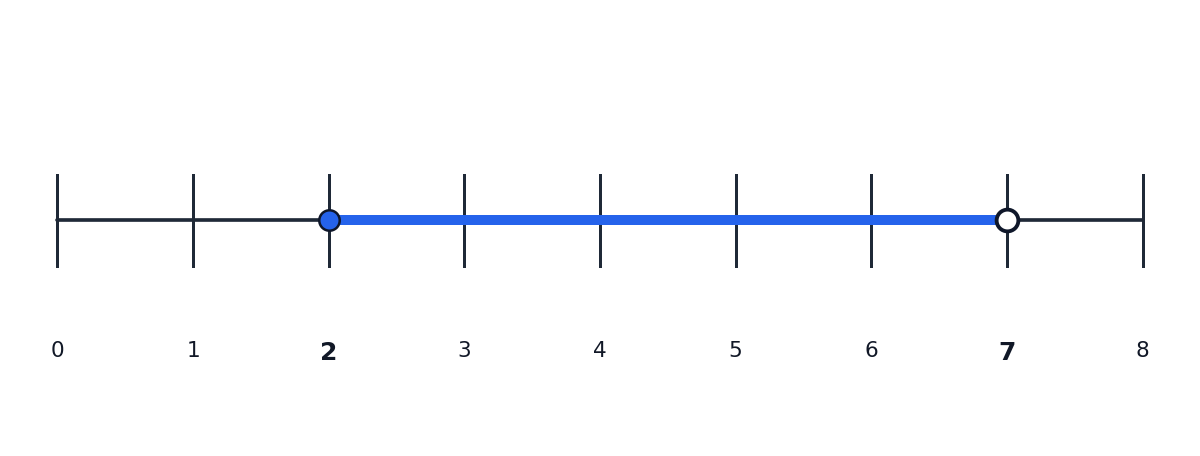
This tells us x must be at least2and less than 7. On the number line, we mark both boundaries and shade the region between them. Here is the process:
Draw a number line and label the two boundary values, 2 and 7.
Place the correct circle at each boundary — we will cover circle types in the next section.
Shade the region between the two circles to show every value that satisfies both conditions.
The result is a single, finite segment. No shading extends to the left of 2 or to the right of 7, because values outside that window fail at least one of the two conditions.
Join the 1M+ learners on CodeSignal
Be a part of our community of 1M+ users who develop and demonstrate their skills on CodeSignal
Choosing the Right Endpoint: Open or Closed
Graphing "Or" Solutions: Two Separated Rays
When a Compound Solution Is a Single Ray
From Inequality to Graph: A Pool Temperature Example
Edge Cases on the Number Line
Compound Type at a Glance
Conclusion and Next Steps
In this lesson, you learned how to turn compound inequality solutions into clear number-line graphs. An "and" solution forms a bounded segment between two endpoints, an "or" solution forms two separated rays heading in opposite directions, and the inequality symbol at each boundary determines whether the circle is open or closed. We also covered the edge cases — an empty number line when "and" has no overlap, a fully shaded line when "or" covers everything, and a single ray when both parts point the same direction.
Now it is time to put these graphing skills to the test. In the upcoming practice exercises, you will identify segment-versus-ray shapes, choose correct endpoint types, and match compound inequalities to their number-line graphs — let's see how sharp your visual instincts have become!
The type of circle at each boundary tells the reader whether that boundary value is included in the solution set. The rule is straightforward:
Symbol
Circle type
Meaning
< or >
Open circle (hollow)
Boundary value is not included
≤ or ≥
Closed circle (filled)
Boundary value is included
Applying this to our example 2≤x<7: the left boundary uses ≤, so we draw a closed circle at 2; the right boundary uses <, so we draw an open circle at 7. Then we shade everything between them. It is entirely common for a compound inequality to mix symbol types, as this one does, so always check each boundary independently.
A quick habit that helps: read the inequality symbol sitting right next to the boundary number and let that symbol alone decide open or closed. If the symbol includes a line underneath (≤ or ≥), the circle is filled; if it does not (< or >), the circle is hollow.
An "or" compound inequality combines two conditions, and a value only needs to satisfy one of them. A typical solved result looks like this:
x<3orx>5
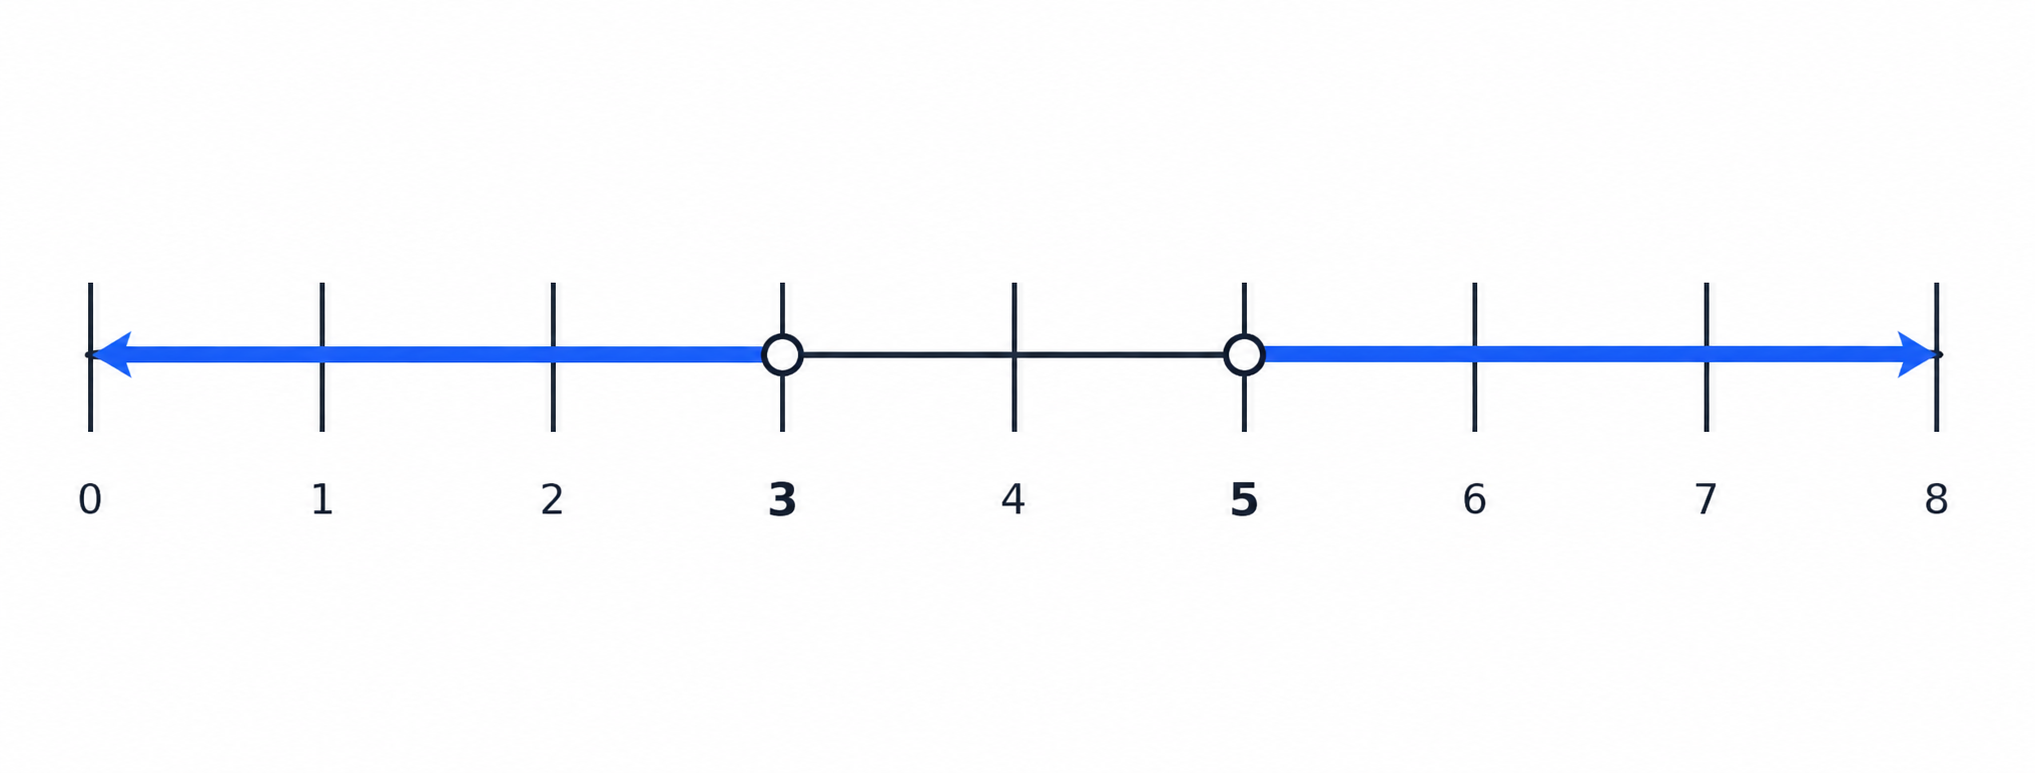
Instead of shading between two boundaries, we draw two rays pointing in opposite directions:
Draw a number line and label the two boundary values, 3 and 5.
At 3, place an open circle (because of <) and shade everything to the left.
At 5, place an open circle (because of >) and shade everything to the right.
The gap between 3 and 5 stays unshaded — those values fail both conditions. This separated-ray pattern is the visual signature of most "or" solutions.
The endpoint rule works exactly the same way here. If a boundary uses ≤ or ≥, swap the open circle for a closed one at that boundary. For example, x≤3 or x>5 would have a closed circle at 3 and an open circle at 5, but the overall two-ray shape stays the same.
Not every compound solution is a segment or a pair of rays. When both parts of a compound inequality point the same direction, the solution collapses to a single ray, and the graph looks just like a simple one-variable inequality.
For example, x>2 and x>5 simplifies to x>5: you place an open circle at 5 and shade to the right — one ray, nothing more. Likewise, x<2 or x<5 simplifies to x<5: an open circle at 5 with shading to the left. The graph shows a single ray even though the original statement had two parts. Always simplify a same-direction compound inequality first, then graph the single condition that remains.
Real-world scenarios often map directly to one of the two shapes. Suppose a community pool is open for swimming when the water temperature T (in °F) satisfies:
72≤T≤84
This is an "and" condition — the temperature must be at least 72and at most 84. On the number line, you would place a closed circle at 72, a closed circle at 84, and shade the segment between them. Every temperature in that window keeps the pool open.
Now consider the flip side: the pool manager receives a maintenance alert when T<72 or T>84. This "or" condition graphs as two rays — one extending left from an open circle at 72 and one extending right from an open circle at 84, with the safe swimming range sitting unshaded in the gap. Notice how the same pair of boundary values produces either a segment or two rays depending entirely on whether the conditions are joined by "and" or "or."
Not every compound inequality follows the standard segment or two-ray patterns. Two special outcomes are worth recognizing before they surprise you.
No solution arises when an "and" inequality has no overlap. For example, x<1 and x>4 asks for a value that is simultaneously less than 1 and greater than 4 — no such number exists. The number line stays completely blank, and the solution is the empty set.
All real numbers arises when an "or" inequality overlaps so completely that every value satisfies at least one condition. For example, x≤5 or x≥3 covers the entire number line because the two regions share the stretch from 3 to 5 and extend outward in both directions with no gap. The line is shaded from end to end, and the solution is all real numbers.
In both cases, recognizing the pattern early saves you from placing unnecessary circles and arrows.
Use this table as a mental checklist whenever you graph a compound solution:
Compound type
Typical shape
Shading direction
Example
"And" (overlap)
Single bounded segment
Between the two boundaries
1<x≤6
"Or" (union)
Two separated rays
Outward from each boundary
x≤−2 or x>4
"And" (same direction)
Single ray
Outward from the tighter bound
x>2 and x>5→x>5
"Or" (same direction)
Single ray
Outward from the looser bound
x<2 or x<5→x<5
"And" (no overlap)
Empty number line
None
x<0 and x>3
"Or" (full overlap)
Entire number line
Everywhere
x≤5 or x≥2
For the standard cases, remember this shorthand: "and" shades inward, "or" shades outward. And at every boundary, let the inequality symbol decide whether the circle is open or closed.