What Distributions Show
Introduction
Welcome to Reading and Describing Distributions, the first course in your statistics journey! This is the opening lesson out of five, so we are right at the starting line. Over the coming lessons, you will learn to look at data displays and describe what they reveal with confidence.
In this first lesson, we focus on the most fundamental skill: identifying what a graph is actually showing. Specifically, you will learn to pick out four key pieces of information from any dot plot or histogram — the variable, the units, the values, and the frequencies. These four pieces form the foundation for everything that follows.
From Raw Numbers to a Picture
Imagine you recorded the number of hours you slept each night for two weeks. You would have 14 numbers sitting in a list. Scanning 14 values is manageable, but what if you had a full year of data — 365 numbers? A long list quickly becomes overwhelming.
A distribution organizes data so you can see the big picture: which values showed up and how often each one appeared. Dot plots and histograms are two common graphs that display distributions. Before we can say anything meaningful about patterns or trends, we first need to understand the basics of what a graph is presenting — and that starts with four questions we will explore next.
Reading a Dot Plot
A dot plot uses a number line as its base. For each observation in the data, a dot is placed above the matching value on that number line. When a value appears more than once, the dots stack vertically.
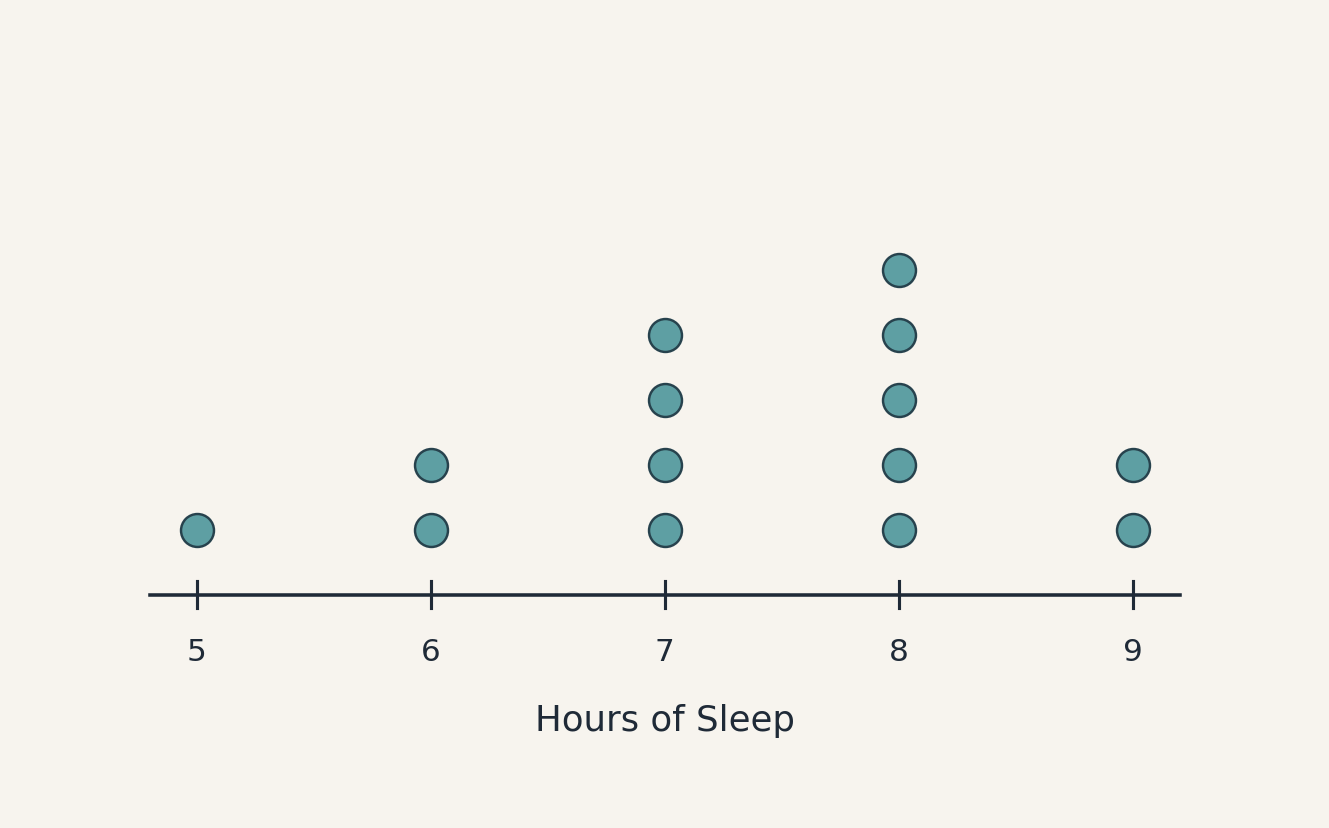
Consider the dot plot above, which shows hours of sleep per night over nights. Let us identify our four key pieces:
- Variable: The quantity being measured — here, hours of sleep per night.
- Units: The measurement scale — here, hours.
- Values: The specific numbers along the horizontal axis, such as , , , , and .
- Frequency: The number of dots stacked above each value. For example, if there are dots above , that means hours of sleep occurred on of the nights.
Every single dot represents one observation (one night), so you can count all the dots to confirm the total number of data points: .