Interpreting Connected Evidence
Interpreting Connected Evidence 🔗
The previous lessons gave you the vocabulary of nodes and edges, the discipline of entity and relationship meaning, and a test for whether a graph perspective fits at all. This one is about what happens after the connections are in front of you. A connected view is persuasive by design: clusters look meaningful, hubs look guilty, and short paths look like relationships. Your job as the architect in the room is to say precisely what the evidence supports and, just as precisely, what it does not.
In this lesson, you will learn to:
- Read paths, proximity, shared connections, and relationship strength for what they actually show, normalizing any count of appearances against the volume that produced it.
- Separate observed relationships from inferred cause by generating competing explanations and naming the evidence that would discriminate between them.
- Turn connected evidence into a bounded recommendation that states its assumptions, names the evidence that would change it, and marks the graph-specific limit.
What Paths, Proximity, and Relationship Strength Actually Tell You 📏
Four features of a connected view carry most of the interpretive weight, and each one is routinely over-read.
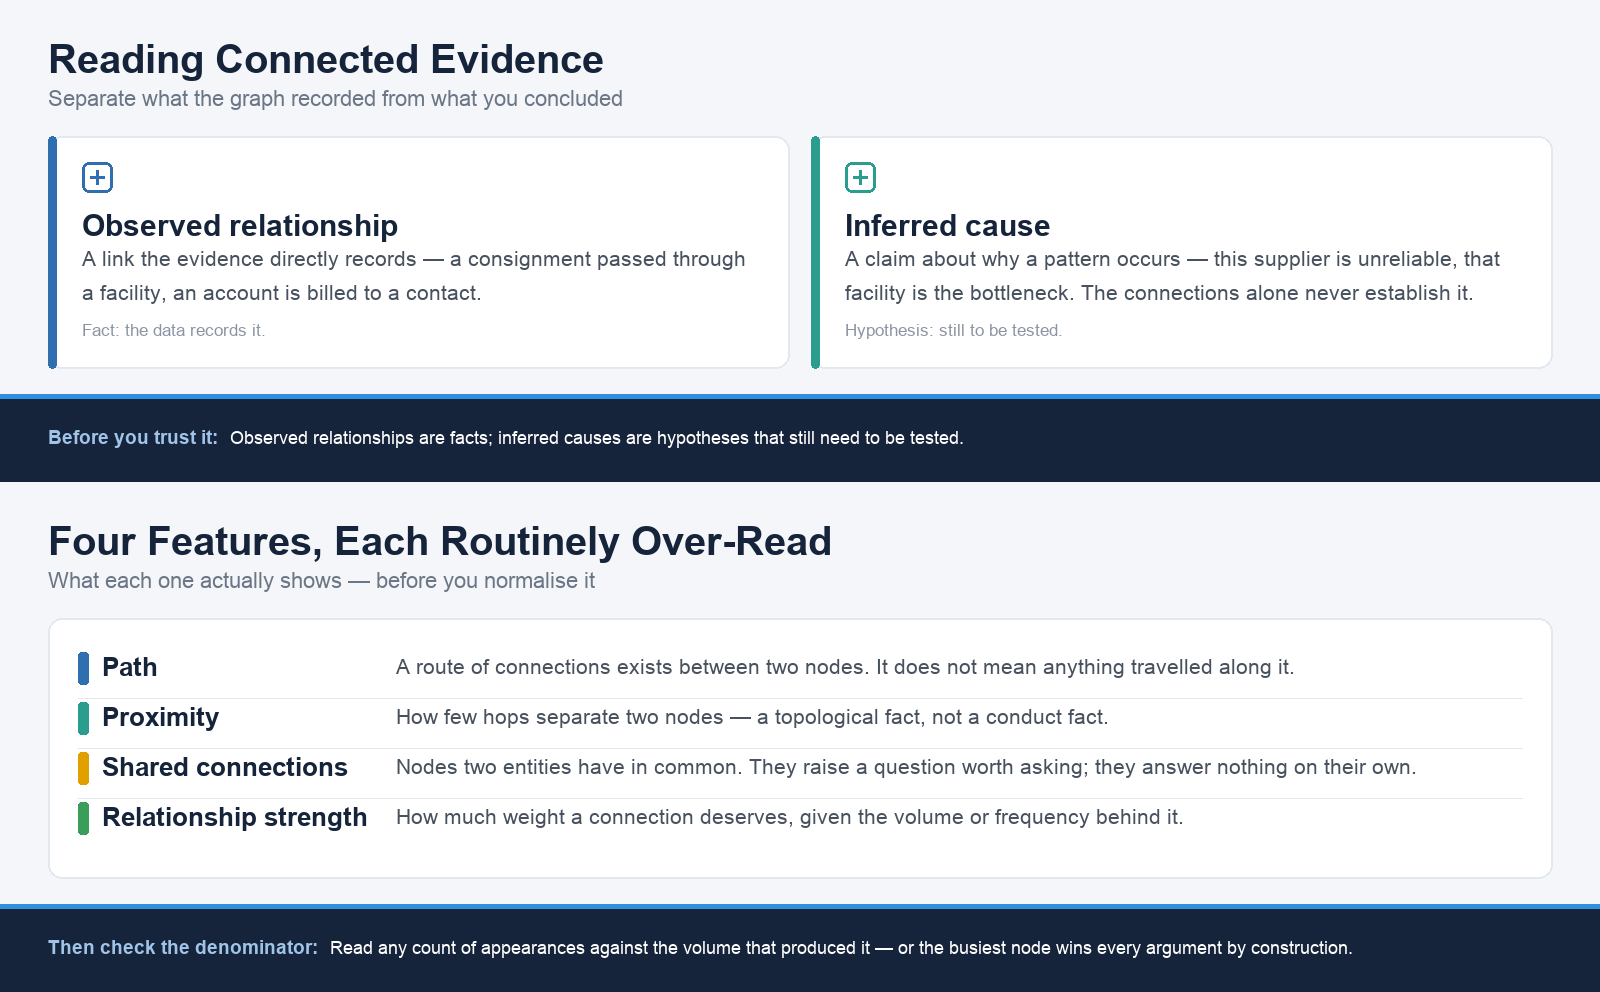
A path is a sequence of connections linking one node to another. It tells you a route exists. It does not tell you that anything traveled along it, or that the entities at either end know each other. Proximity is how few hops separate two nodes. Two suppliers sitting two hops apart through a shared parent group are close in structure, not necessarily close in behavior: proximity is a topological fact, not a conduct fact.
Similarly, shared connections are the nodes two entities have in common, such as a transport partner both use. Shared connections raise a question worth asking; they answer nothing on their own.
The feature that most often rescues an analysis is relationship strength: how much weight a connection deserves given its volume or frequency. If one transport partner handles 60% of all regional volume, it will appear in most incidents purely by construction. Its prominence in the graph is an artifact of its share, not evidence of fault. Consequently, any count of appearances should be read against the denominator that produced it. Without that normalization, the busiest node in the network wins every argument it is involved in, regardless of merit.
Separating Observed Relationships from Inferred Cause 🧪
Everything in a connected view falls into one of two categories, and the discipline is to label them out loud. An observed relationship is one the evidence directly records: a consignment passed through a facility, an account is billed to a contact, a device was installed at an address. An inferred cause is a claim about why a pattern occurs: this supplier is unreliable, that facility is the bottleneck. The connections alone never establish the second kind.
The practical method is to generate at least three competing explanations for the same pattern and then state, for each, what the network evidence would look like if that explanation were true. This forces the pattern to earn its interpretation rather than confirming whoever framed the question first.
The exchange below is between Jessica, an analyst convinced the graph already names a culprit, and Natalie, the senior data steward who slows her down to separate what the evidence observed from what she inferred.
- Jessica: This billing contact links to most of the disputed accounts, so they're the one behind the chargebacks.
- Natalie: What's observed there, exactly?
- Jessica: That the same contact appears on those accounts' billing records.
- Natalie: Right, so "appears on many accounts" is observed. "Behind the chargebacks" is inferred. That contact is a managing agent listed on a large share of the building's accounts, so they'd appear on almost any account by construction. Two other explanations fit the same picture equally well.
- Jessica: So what would separate them?
- Natalie: Chargeback rates per account, split by whether that agent is listed, each against how many accounts the agent actually covers. If the agent's accounts dispute at a rate above their share, the reading holds. If not, we're looking at the wrong node.
Notice that Natalie does not dismiss the hypothesis. She names what is observed, names what is inferred, and specifies the evidence that would discriminate between the readings.
Turning Graph Evidence into a Bounded Recommendation 🧾
A stakeholder who came for a culprit will not thank you for three explanations unless you show why the ambiguity is warranted and hand them a way through it. A defensible recommendation therefore does four things:
- It lands a bounded position — often "defer this decision while we compare X".
- It states the assumptions that position rests on.
- It names the evidence that would change it.
- It states the graph-specific limit plainly.
That limit is worth memorizing: connected evidence surfaces relationships and candidates for investigation, not proof of cause.
The core takeaway is that connected views are strongest at generating well-shaped questions and weakest at settling them, so your value lies in marking the boundary between the two. Two quick self-checks come next to sharpen your pattern-spotting on relationship strength and observed-versus-inferred evidence, followed by a written analysis of a network pattern from a live procurement case that a business audience could actually act on.
