Plotting Generated Arrays
Introduction
Welcome back to From Lists to Arrays. Here we’ll connect generated arrays to a practical result: saved charts. We’ll use np.arange to number the days on a bar chart and np.linspace to place evenly spaced measurements on a line chart. Pre-built Matplotlib helpers do the drawing, so we can focus on the arrays.
Why Charts Need Generated Arrays
A chart needs coordinates: values that say where each point belongs along an axis. Generated arrays are useful when those coordinates follow a clear pattern, such as consecutive days or evenly spaced measurement times. As you may recall from the previous lesson, np.arange creates values using a step, while np.linspace creates a chosen number of evenly spaced values. Here, we’ll put both tools to work as chart inputs.
Meet the Plot Helpers
The plotting helpers handle the drawing, so we only supply the arrays. Each helper labels its axes and saves the chart as an image file next to our code. The imports make Matplotlib and NumPy available to the program.
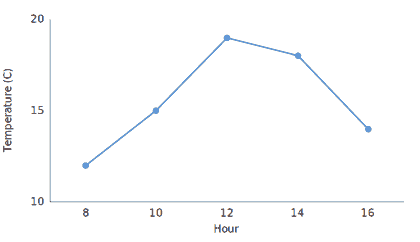
plot_steps_bar draws one bar for each day, and plot_temperature draws a line with a circle on each reading. In both, the first argument supplies the horizontal positions and the second supplies the values. We will call these helpers, not change them.
A Timeline Axis with np.arange: Daily Steps
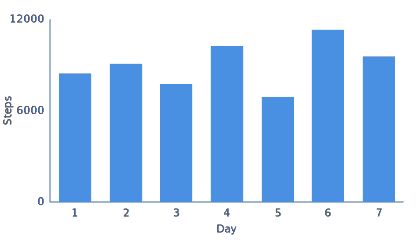
For a seven-day chart, we need seven horizontal positions to match the seven step counts. np.arange(1, 8) starts at 1 and stops before 8, producing the day numbers 1 through 7. We pass that array and the step-count array to the bar chart helper in the same order, so each day lines up with its count.
The two arrays have matching lengths, so every day pairs with exactly one count. The helper saves the chart as steps.png, which shows one bar for each day.