Identifying Data Quality Issues
Introduction
Welcome to Evaluating and Improving Data Quality, the second course in our learning path! In the first course, we built a strong foundation by exploring why data quality matters and learning how to measure it with core metrics like accuracy, completeness, and consistency. Now we are ready to roll up our sleeves and put that knowledge into practice.
This course is all about moving from understanding quality to actively finding and fixing problems. In this first lesson, we will learn to recognize the most common data quality issues that appear in records, tables, and dataset summaries. By the end, you will be able to spot these problems quickly and describe them clearly — a skill that every step of this course builds on.
From Metrics to Problems
As you may recall from our earlier course, we defined several quality dimensions: accuracy, completeness, consistency, timeliness, validity, relevance, and reliability. Those metrics are powerful tools for describing what is wrong. But before we can measure anything, we need to see the problem in the first place.
Think of it like visiting a doctor. A thermometer can confirm a fever, but the doctor first has to notice the symptoms. In the same way, recognizing symptoms in our data is the essential first step before we can measure, classify, or fix anything. That is exactly the skill we will build in this lesson.
Six Common Data Quality Issues
Spotting Issues in Records and Tables
Let us see how these issues look in practice. Consider the following small table of customer orders:
| Order ID | Customer Name | Order Date | Country | |
|---|---|---|---|---|
| 1001 | Lena Torres | lena.t@mail.com | 2024-03-15 | US |
| 1002 | Lena Torres | lena.t@mail.com | 2024-03-15 | US |
| 1003 | Raj Patel | 2024-13-01 | India | |
| 1004 | Amy Chen | amy.c@mail.com | 2024-04-10 | usa |
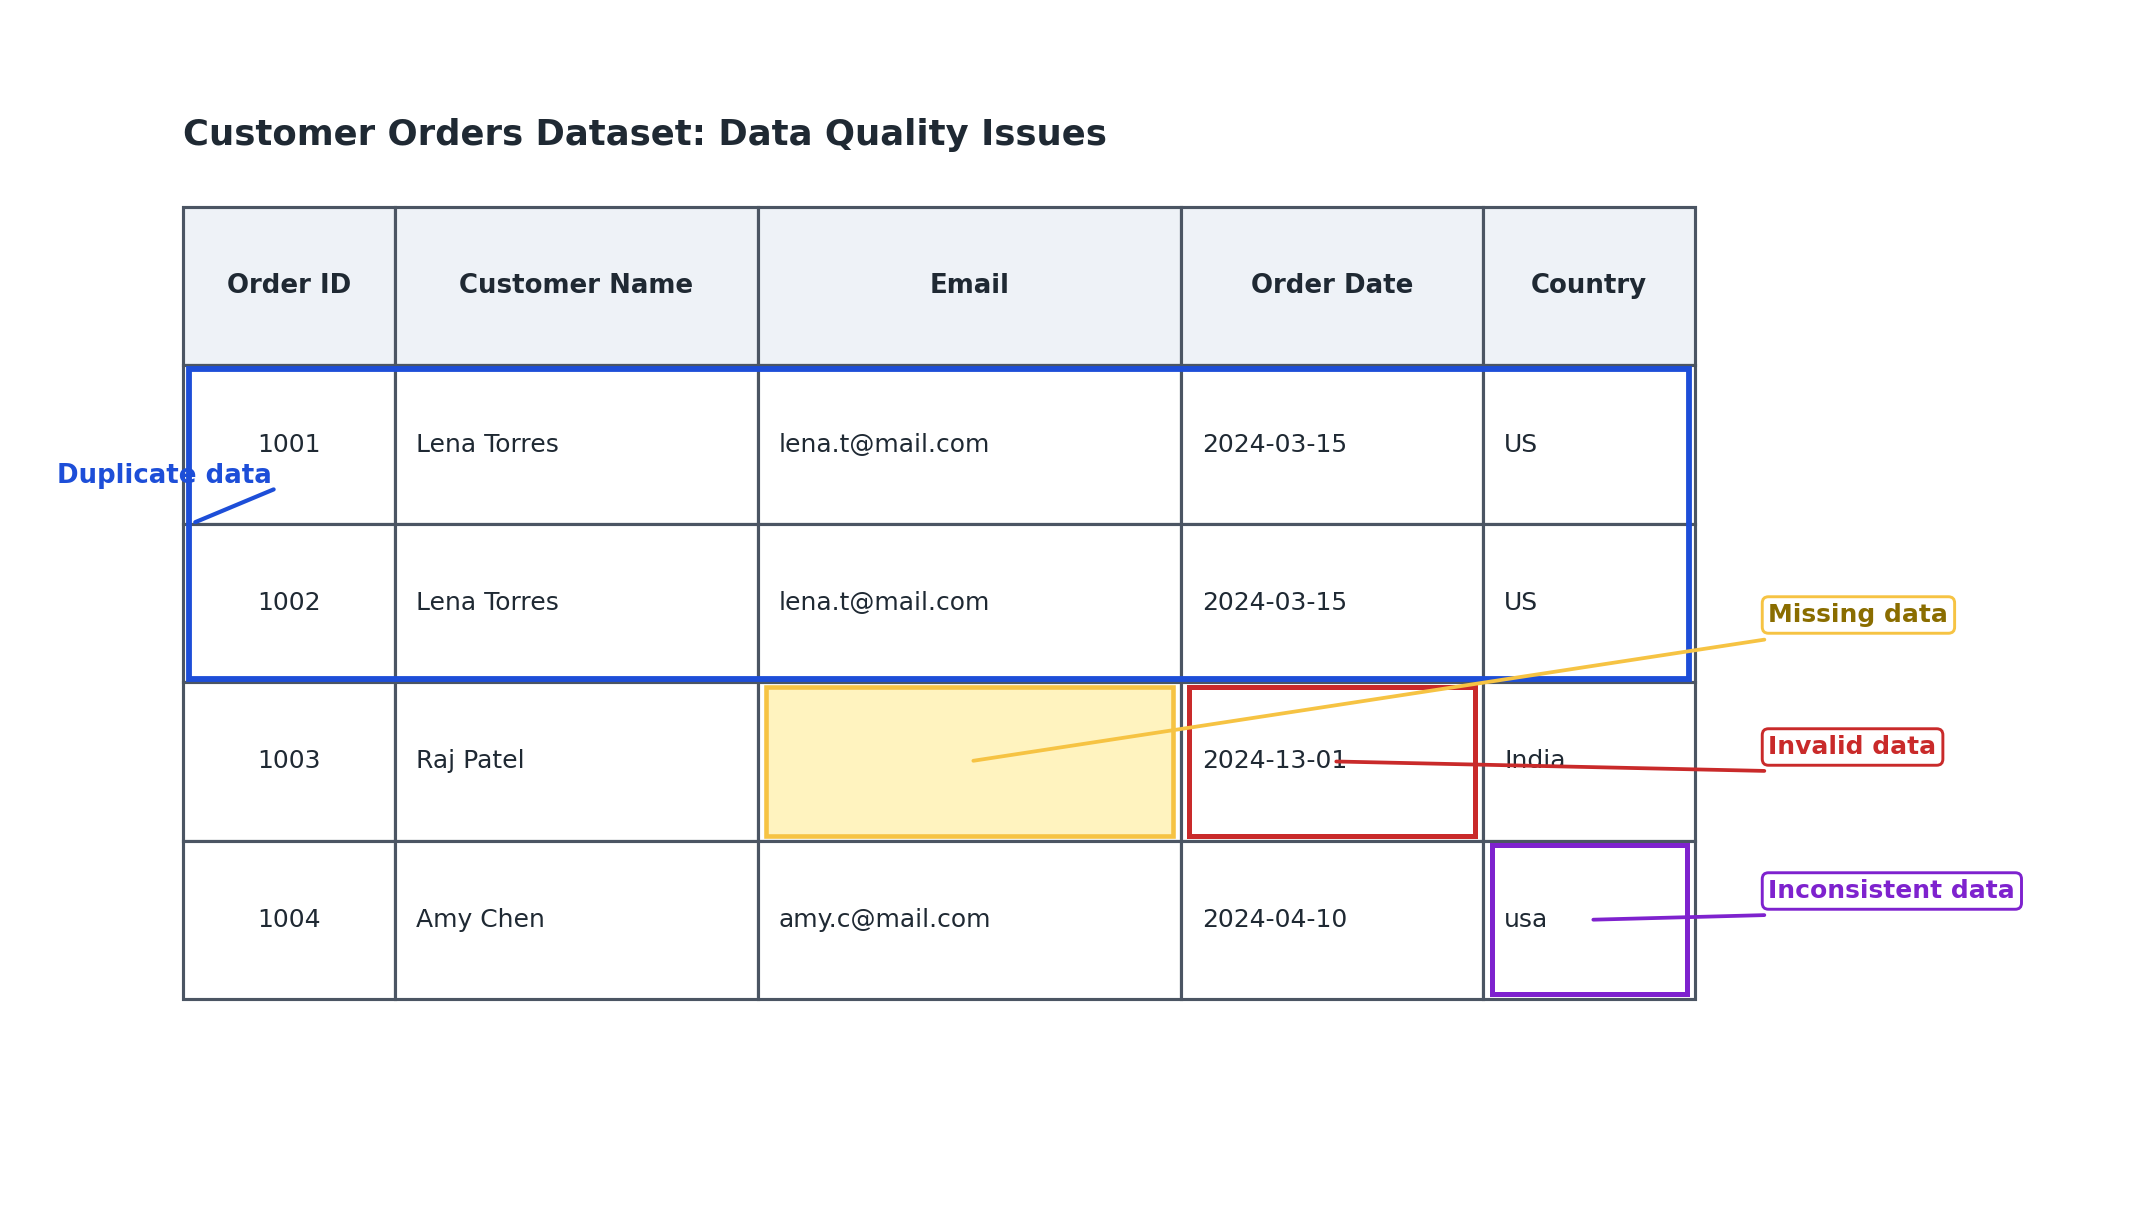
Even in just four rows, we can find several problems:
- Duplicate data: Rows 1001 and 1002 are identical in every field.
- Missing data: Row 1003 has no email address.
- Invalid data: The date
2024-13-01contains month 13, which does not exist. - Inconsistent data: Row 1004 records the country as "usa" in lowercase, while other rows use "US."
Notice that a single row can contain more than one issue. Row 1003, for example, has both a missing value and an invalid date. Scanning records carefully and checking each column is the best way to catch overlapping problems.
Connecting Issues to Quality Metrics
Describing Issues Clearly
Once we spot a problem, it helps to describe it in a structured way so that others can understand and act on it. A good issue description typically includes three parts:
- Issue type — which of the six categories does it fall into?
- Affected field — which column or value is involved?
- Likely impact — which quality metric is affected, and what could go wrong downstream?
For example, we might write: "The Email field in row 1003 is missing, which reduces completeness and could prevent us from sending order confirmations." This kind of short, focused summary is far more useful than simply saying "there's a problem with the data."
Building the habit of documenting issues this way creates a shared language within your team. It also makes the path from identifying a problem to resolving it much shorter, because the description already points toward what needs to change. As we move through the rest of this course, you will see how these clear descriptions feed directly into cleaning, validation, and governance workflows.
Conclusion and Next Steps
In this lesson, we explored six common data quality issues — missing, duplicate, invalid, inconsistent, outdated, and irrelevant data. We practiced spotting them in a sample table, connected each issue type back to the quality metrics from our earlier course, and learned how to document problems in a clear, structured way.
Now it is time to put that skill to the test with a set of hands-on practice exercises. You will identify issues in sample rows, match examples to their categories, and fill in structured issue summaries — all great preparation for the deeper topics we will tackle next!
