Evaluate Framed Risk Claims
Introduction 🎉
Welcome to Evaluate Framed Risk Claims! This lesson brings everything you learned so far together into a single workflow. Instead of introducing a brand-new tool, you will learn how framing shapes the way people feel about a risk, and how to combine all your skills to evaluate any claim you encounter. By the end of this lesson, you will have learned to:
- Recognize gain and loss frames by noticing which side of an outcome a speaker chose to emphasize, since describing the same fact as "90% survive" or "10% die" can shift how people feel even though the data has not changed.
- Restate claims in neutral terms by flipping the frame, adding absolute numbers, and supplying the context a reader needs to judge real-world significance for themselves.
- Evaluate any risk claim with a structured checklist that draws on every skill from this course, so you never have to accept a claim purely at face value.
Consider a thought experiment: A hospital tells patients considering a surgery that "90 out of 100 patients survive this procedure." Now imagine another hospital describes the exact same procedure by saying "10 out of 100 patients die from this procedure." Both statements convey the same outcome, yet research consistently finds that people feel more willing to choose surgery when they hear the survival version.
This is the essence of framing. The underlying data has not changed at all, but the way it is presented shifts perception, emotion, and even decisions. Understanding this effect is the foundation of everything you will do in this lesson. Let's start by naming the two most common frames and seeing how they work in practice.
Gain Framing and Loss Framing 🔄
The most common framing technique is the contrast between gain framing and loss framing. A gain frame highlights what is kept, saved, or achieved, while a loss frame highlights what is lost, spent, or suffered. Here are several everyday examples:
| Gain Frame | Loss Frame | Underlying Fact |
|---|---|---|
| "90% of patients survive" | "10% of patients die" | 90% survival rate |
| "Our product is 95% effective" | "Our product fails 5% of the time" | 5% failure rate |
| "Save $200 by switching today" | "Lose $200 every year by not switching" | $200 annual difference |
| "75% of students pass" | "25% of students fail" | 75% pass rate |
The math connecting any gain frame to its loss counterpart is simple. If a positive outcome has probability , then the negative outcome has probability :
A quick visual makes the equivalence easier to see:
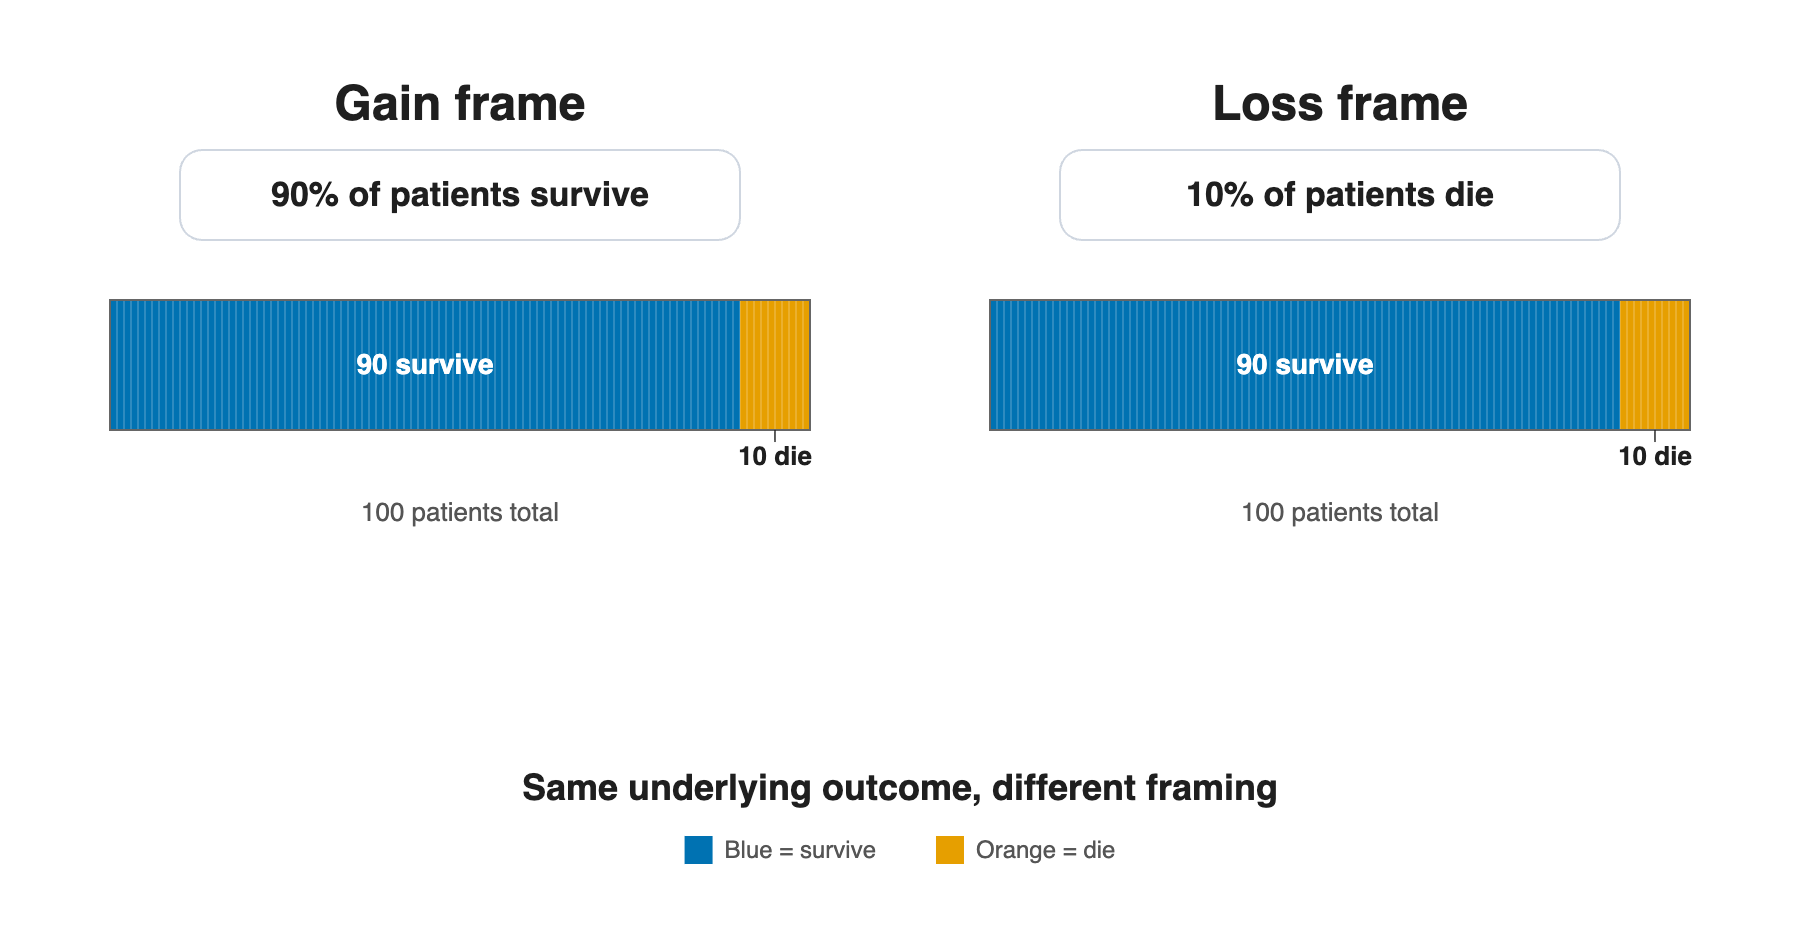
For dollar amounts the same logic holds: saving $X is mathematically identical to not losing $X. The key insight is that neither frame is more "correct" than the other. They are two descriptions of the same coin. What matters is noticing which side the speaker chose and asking why.
Advertisers and advocates tend to pick the frame that best supports their goal. A pharmaceutical company promoting a drug will lean toward the gain frame ("95% effective"), while a critic may prefer the loss frame ("fails 1 in 20 times"). Recognizing this deliberate choice is the first step in evaluating a framed claim.
Neutralize the Claim 🧼
Once you spot a frame, the next move is to restate the claim neutrally. A neutral restatement presents both sides and includes enough context for the reader to judge real-world significance. You can follow three steps:
- Flip the frame. Convert the stated figure to its complement. If the claim says "85% succeed," note that 15% do not.
- Add absolute numbers. Translate percentages into counts whenever possible. "85% of 2,000 applicants succeed" means about 1,700 succeed and 300 do not.
- Supply context. Include the baseline, comparison group, or time window that gives the number meaning. As you saw in an earlier lesson, a number without context can be misleading.
Let's try a quick example. A job training program advertises: "Graduates see a 50% increase in salary!" That sounds impressive, so let's apply our steps. This claim is not mainly a success/failure frame with a simple complement. Instead, it uses a large relative increase, so the key move is to convert the relative claim to absolute terms. Suppose the average salary before the program was $30,000. A 50% relative increase means an extra $15,000, bringing the total to $45,000:
The absolute change is $15,000 per year. Next, we add context. How does $45,000 compare to similar workers who did not take the program? What was the cost and duration of training? And, as we discussed in Lesson 4, were dropouts included, or is this a survivor-only figure?
A neutral restatement might read: "Graduates earned an average of $45,000, up from $30,000 before the program, a $15,000 absolute increase. The program cost $10,000 and took one year. These figures reflect only those who completed the program." This version provides enough information to support an independent judgment rather than relying on the emotional pull of "50% increase."
Building an Evaluation Checklist 🛠️
Throughout this course, you have developed individual skills for analyzing risk claims. Now let's combine them into a single checklist you can use whenever you encounter a probability or risk statement in the real world.
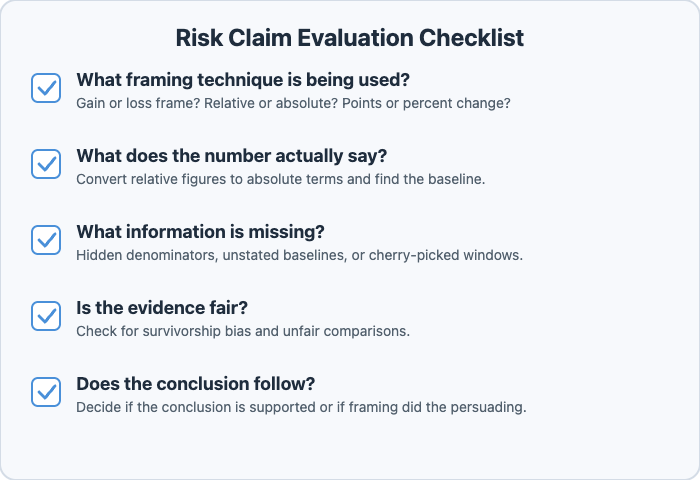
- What framing technique is being used? Is this a gain or loss frame? Does the claim lean on relative or absolute numbers? Is the change stated in percentage points or percentage change?
- What does the number actually say? Convert relative figures to absolute terms. If a claim says "doubled," find the baseline so you know whether that means a jump from 1% to 2% or from 20% to 40%.
- What information is missing? Look for hidden denominators, unstated baselines, or cherry-picked time windows.
- Is the evidence fair? Check for survivorship bias and unfair comparisons.
- Does the conclusion follow? After answering the questions above, decide whether the stated conclusion is genuinely supported, or whether the framing did most of the persuading.
This checklist is not a rigid formula. Sometimes a claim will be straightforward and only one or two questions will matter. Other times, several issues will stack up. The goal is to have a reliable set of prompts so that we never accept a claim purely at face value.
A Complete Worked Example 🏗️
Let's put the full checklist to work. Suppose you encounter this headline:
"New study: Premium HealthPlus supplements reduce the risk of joint pain by 40%!"
Step 1 — Identify the frame. The claim uses a relative risk reduction presented in a gain frame. The word "reduce" sounds beneficial, and "40%" sounds large.
Step 2 — Find the actual numbers. The fine print reveals that in the control group, 5 out of 100 people developed joint pain over two years. In the supplement group, 3 out of 100 did. You can verify the relative figure:
The 40% figure is mathematically correct, but it represents an absolute risk reduction of only 2 percentage points (moving from 5% down to 3%). This is a classic example of how a large relative percentage can be used to make a small absolute change seem much more significant.
Step 3 — Check for missing context. Who were the participants? If they were all over age 60 with a family history of joint problems, the results may not apply to younger, healthier people. How long did the study run? Two years might be too short to confirm lasting effects. And what did the supplement cost?
Step 4 — Evaluate the evidence. Was this a randomized trial, or did participants self-select? If healthier, more active people were the ones choosing supplements, the two groups may differ in ways that explain the result, creating the kind of unfair comparison we studied in Lesson 4.
Step 5 — Does the conclusion follow? The 40% relative reduction is mathematically correct but potentially misleading. The absolute benefit is modest: for every 100 people taking the supplement, roughly 2 fewer develop joint pain. Whether that justifies the cost depends on individual circumstances, but the headline alone does not tell you enough to decide.
A neutral restatement: "In a two-year study, joint pain rates dropped from 5% to 3% among supplement users, an absolute reduction of 2 percentage points. The 40% figure describes the same change in relative terms."
Conclusion and Next Steps
In this final lesson, you explored how framing shapes perception and learned to recognize gain and loss frames in everyday claims. You practiced restating claims in neutral terms by flipping the frame, adding absolute numbers, and supplying missing context. Most importantly, you assembled a five-question evaluation checklist that draws on every skill from this course: translating between absolute and relative risk, separating percentage points from percentage change, spotting missing context, and recognizing biased evidence.
Up next is a set of practice exercises where you will match equivalent framings, convert framed statistics into neutral alternatives, identify persuasive techniques, and walk through full evaluations of real-world risk scenarios. Time to put the complete toolkit to the test and show what you have learned!
