Trusting Your Data
Introduction
Welcome back to Data Quality Foundations! This is our fourth and final lesson, and it brings together everything we have been building toward. We started by understanding why data quality matters, then learned how to frame the right business question, and most recently defined seven core metrics for measuring quality from every angle. Those skills equip us to describe data quality in precise terms. Now we face the harder, more practical challenge: deciding whether imperfect data is still trustworthy enough to act on. By the end of this lesson, you will be able to look at a flawed dataset and confidently judge whether it can support a specific decision, needs further review, or should not be used at all.
The Reality of Imperfect Data
Here is an uncomfortable truth that experienced analysts learn early: virtually no real-world dataset scores perfectly across all seven quality metrics. There will almost always be a few missing values, a slightly outdated record, or a minor formatting inconsistency. If we waited for flawless data before making any decision, we would never decide anything at all.
That does not mean we should ignore quality problems. It means we need a practical way to weigh those problems against what is at stake. The real skill is not finding perfect data; it is knowing how much imperfection we can tolerate given the decision we need to make.
Decision Risk: The Missing Piece
Setting a Quality Bar
Once we understand the risk level of a decision, we can set a quality bar: the minimum level of data quality we need before we feel comfortable acting. This is not a single number. It is a set of expectations across the metrics that matter most for the situation.
Consider two scenarios:
| Scenario | Decision Risk | Key Metrics to Watch | Acceptable Quality Bar |
|---|---|---|---|
| Choosing snack options for a team event | Low | Relevance, basic completeness | A few missing survey responses are fine |
| Setting drug dosage guidelines from clinical data | Very high | Accuracy, completeness, reliability, validity | Nearly all metrics must be near perfect |
Notice how the quality bar shifts with the stakes. For the team snack decision, we mostly need data that is relevant and reasonably complete. For clinical dosage decisions, we need strong scores across multiple metrics because the consequences of error are severe. There is no universal threshold that works for every situation. The quality bar is always relative to the decision at hand.
Choosing the Right Quality Checks
Knowing which checks to run before trusting a dataset is just as important as knowing the metrics themselves. Running every possible check on every dataset is not realistic, so we prioritize based on the decision's importance and the most likely risks.
A practical approach is to ask three quick questions:
- What is the worst thing that could happen if this data is wrong? This tells us the risk level and helps us decide how thorough our checks need to be.
- Which metrics matter most for this specific decision? For a time-sensitive operational decision, timeliness and accuracy are critical. For a broad market research summary, relevance and completeness may matter more.
- What is the fastest way to verify those metrics? Sometimes a quick spot-check of a few records is enough. Other times, we need a systematic review or a cross-reference against a second source.
For low-risk decisions, a brief review of completeness and relevance might be sufficient. For high-risk decisions, we might need to verify accuracy against an external source, confirm consistency across systems, and validate that every field follows expected rules. The goal is to match our effort to the stakes.
Approve, Review, or Reject
From Metrics to Action
The path from raw data to a trusted decision follows a clear sequence that ties together everything we have covered in this course. We start by understanding the business question (Lesson 2), then assess the data using quality metrics (Lesson 3), and finally weigh those findings against the risk of the decision (this lesson). Here is that flow in five steps:
- Clarify the decision and its risk level.
- Identify which quality metrics matter most for that decision.
- Run targeted checks on those metrics.
- Compare findings to the quality bar set by the decision's risk.
- Decide: approve, review further, or reject.
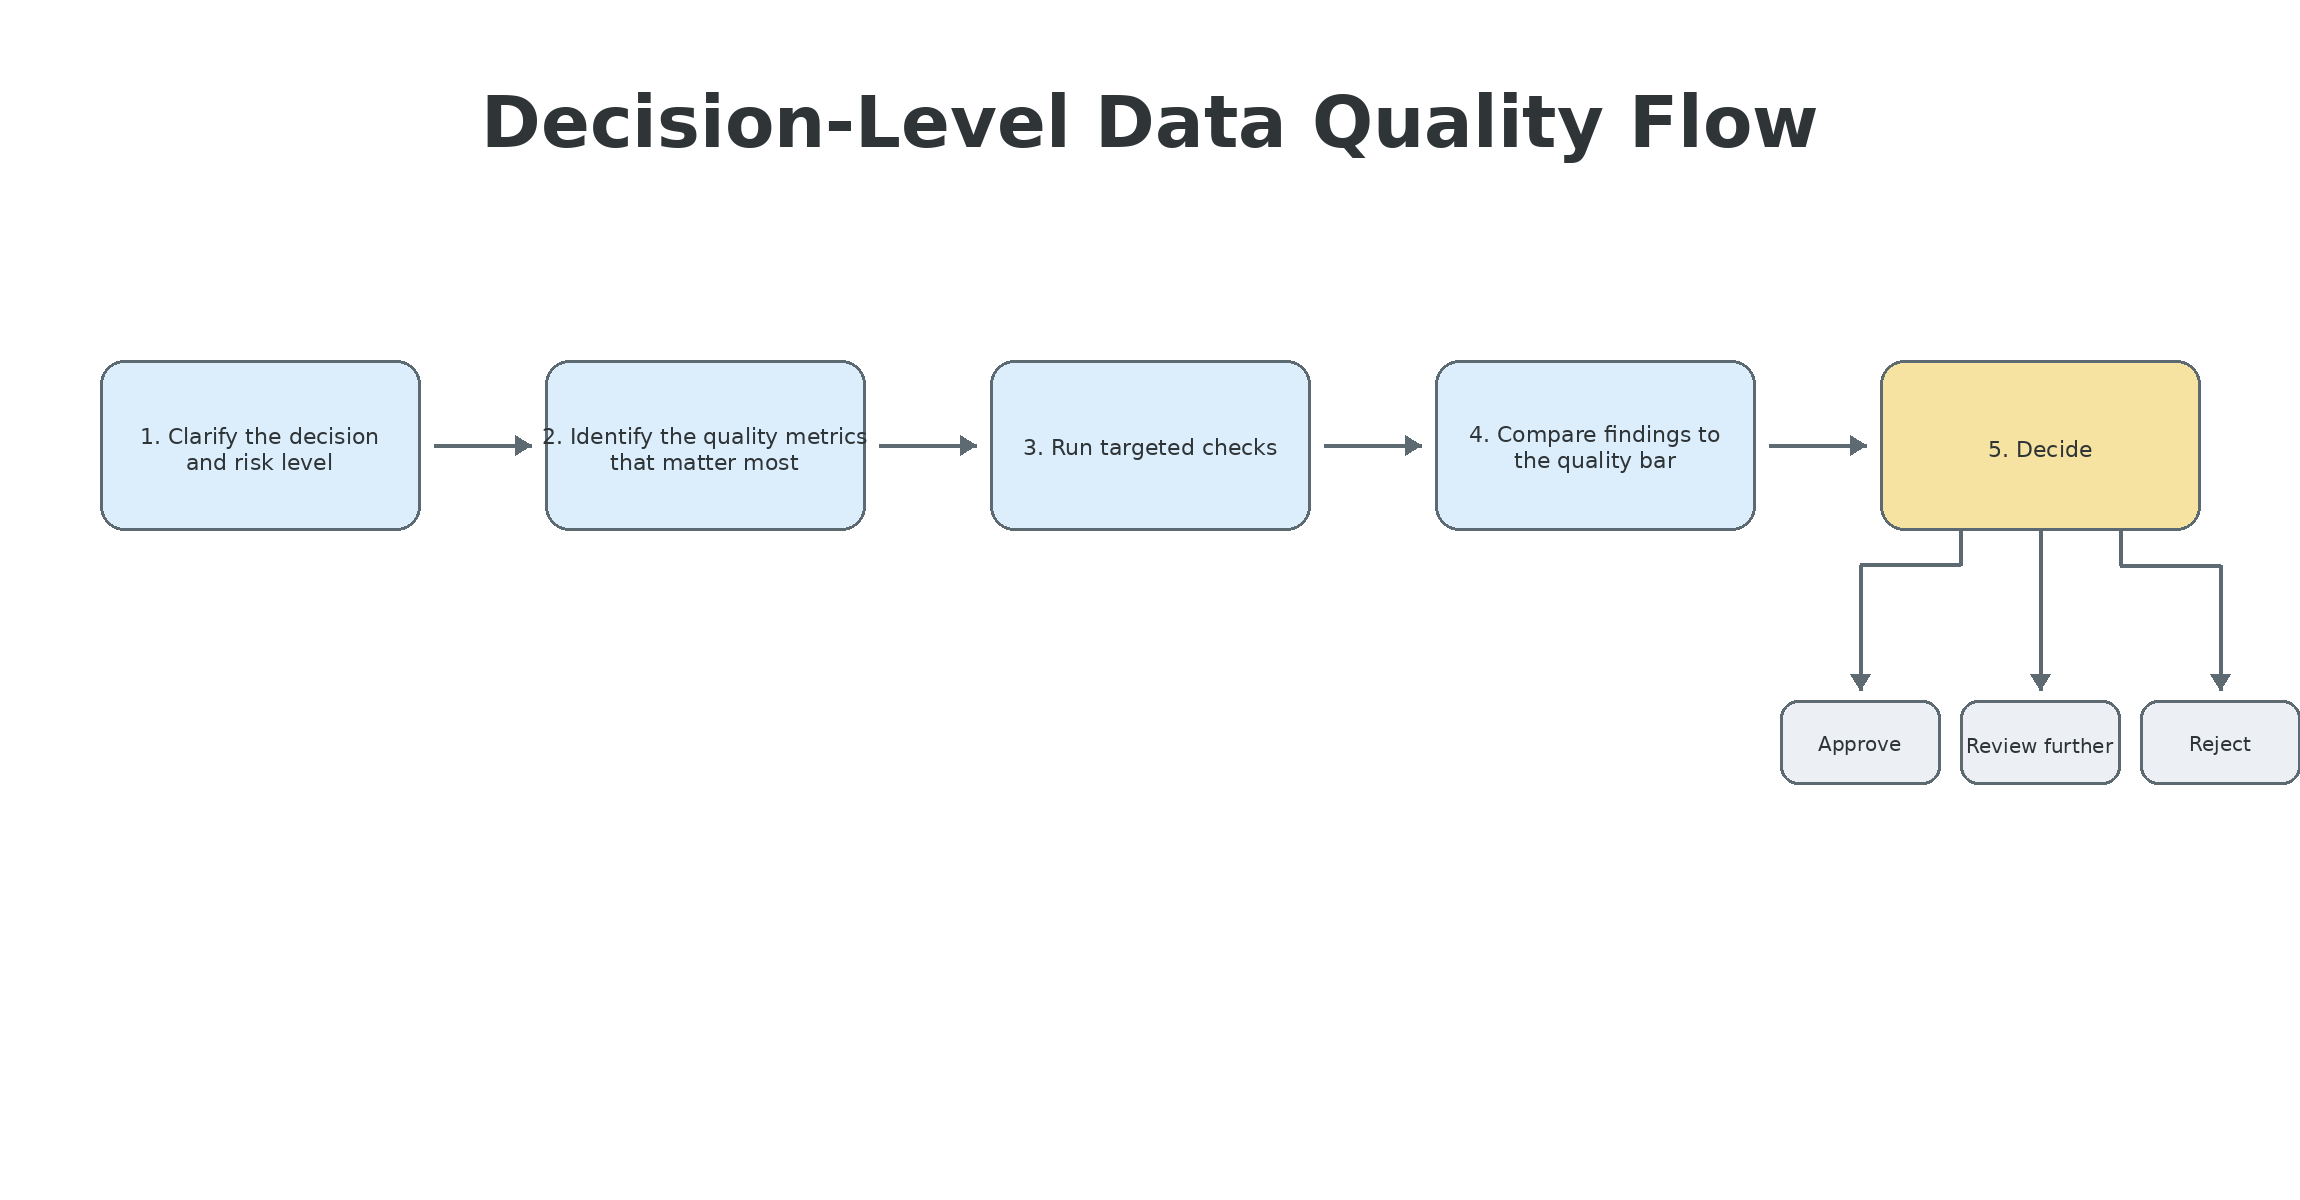
This framework does not eliminate uncertainty, but it gives us a structured and repeatable way to handle it. Instead of guessing whether data is "good enough," we can point to specific metrics, explain the risk, and justify our recommendation. That kind of reasoning is what separates a careful analyst from someone who just hopes the data is fine.
Conclusion and Next Steps
In this lesson, we learned that trustworthy data does not have to be perfect — it has to be good enough for the decision it supports. We explored how decision risk shapes our quality expectations, how to choose the right checks for the situation, and how to arrive at a clear approve, review, or reject recommendation. Combined with the metrics and skills from our earlier lessons, this gives us a complete toolkit for evaluating data quality from question to decision.
That wraps up the teaching portion of Data Quality Foundations! Now it is your turn to put this decision-level thinking into action. In the upcoming exercises, you will rank datasets by risk, select the right quality checks for real scenarios, and make approve-or-reject calls on realistic dataset summaries. Let's see how sharp your data judgment has become!
