Comparing Function Representations
Introduction
Imagine that a parking manager gives you a pricing formula, a spreadsheet, and a chart. All three may describe the same fees, but the quickest way to test that claim is to choose the same number of hours and compare the resulting charge in each format. That is the focus of this fourth and final lesson in Coordinates and Function Representations.
In the first lesson, you learned to locate coordinates; in the second, you read input-output information from graphs; and in the third, you generated table rows from equations. Now you will use those skills together to check whether three representations agree. By the end of this lesson, you will be able to:
- Match a value table to the equation that produces its outputs.
- Translate table rows into ordered pairs on a graph.
- Check whether plotted points agree with a table.
- Identify which representation is inconsistent when one pair does not match.
One Relationship, Three Views
An equation, value table, and graph are three ways to display the same input-output relationship. The equation gives the rule, the table records selected results, and the graph shows those results as locations on the coordinate plane.
Suppose a parking garage charges a base fee of plus dollars for every hour:
For hours:
The same result can appear in three forms:
| Representation | What it records when |
|---|---|
| Equation | |
| Value table | The row |
| Graph | The point |
The format changes, but the relationship does not. Because a table usually contains selected inputs rather than every possible input, you will compare the representations at the inputs shown in the table.
The Agreement Rule
The shared relationship gives us a precise way to check the three forms. For every input listed in the table, the equation output, table output, and graph output should agree:
Here, is the output calculated from the equation. The table output is the number recorded beside that input, and the graph output is the -coordinate at the same -value.
If every checked pair agrees, the representations are consistent for those inputs. If even one listed pair disagrees, the equation, table, and graph cannot all represent the same relationship as shown.
Match An Equation To A Table
The first comparison is between a rule and a table. You already know how to calculate table rows; now use substitution as evidence rather than relying on the appearance of the numbers.
Consider this table:
| Input | Listed output |
|---|---|
Test each candidate equation at every listed input:
| Candidate equation | Output at | Output at | Output at | Conclusion |
|---|---|---|---|---|
| Matches every row | ||||
| Does not match | ||||
| Does not match |
The first equation matches all three rows. The third equation happens to produce when , but that single match is not enough.
For each candidate, use this order:
- Choose an input from the table.
- Substitute it into the equation.
- Compare the calculated output with the listed output.
- Repeat for every input before deciding.
Turn Table Rows Into Graph Points
Once an equation and table agree numerically, translate each table row into a coordinate. A row with and becomes
To place that pair on the coordinate plane:
- Locate on the horizontal -axis.
- Move vertically until you reach on the -scale.
- Mark the point at that intersection.
- Repeat for every table row.
The first coordinate always gives the horizontal position, and the second gives the vertical position. Therefore, is a different point from .
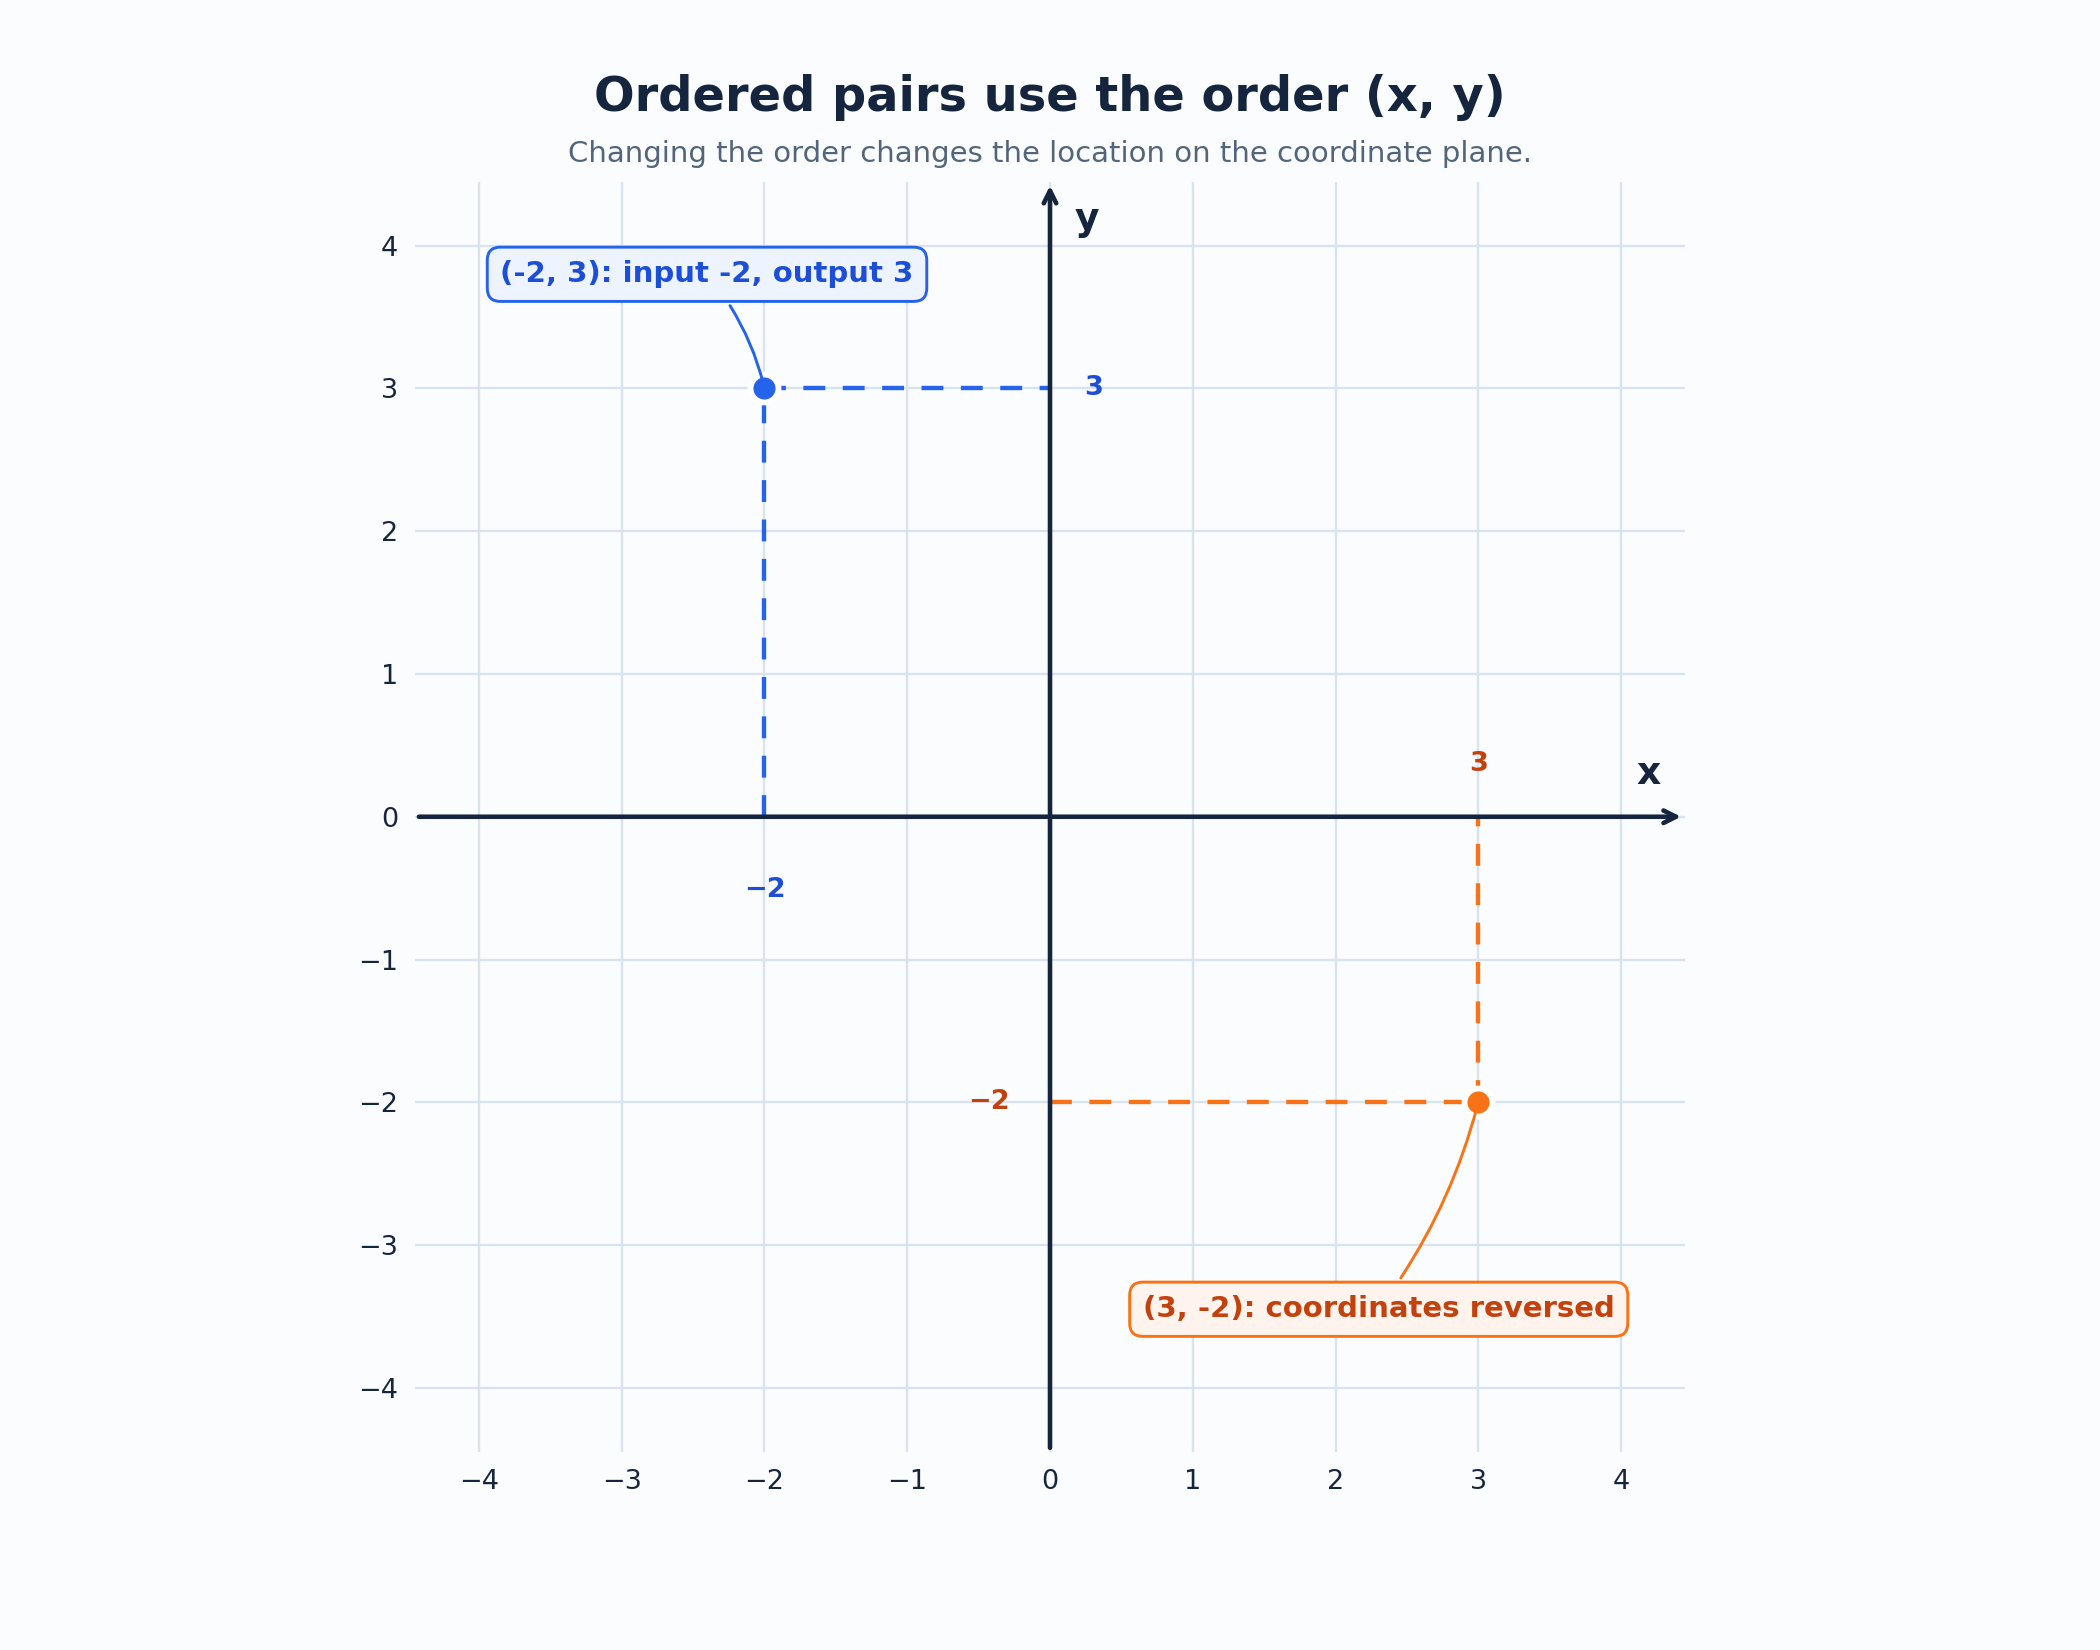
Use the coordinate-plane skills from the first lesson to handle negative numbers, fractions, decimals, and different graph scales. A line or curve may pass through the points when the function is continuous, but connecting points does not correct an incorrectly plotted coordinate.
Verify A Graph Against A Table
You can also work in the opposite direction: start with a table and check whether a graph contains the required locations. Suppose the table comes from :
| Input | Table output | Required graph location |
|---|---|---|
At , the graph must have a point at . At , it must have a point at , and at , it must have a point at .
If the graph shows instead of , that row does not match. The point may look close, but graph coordinates must agree exactly; also check the axis scale before judging a point. An additional graph point is not automatically an error because a table may show only selected inputs.
Check All Three Representations
The same process works for nonlinear functions. Consider
and compare the equation, a table, and the corresponding graph points:
| Input | Equation calculation | Table output | Required graph point | Result |
|---|---|---|---|---|
| Match | ||||
| Match | ||||
| Match |
Each equation calculation agrees with the table, and each table row appears at the correct graph location. Therefore, the three representations are consistent for the listed inputs.
The function's shape does not change the checking method. Whether the graph is a line, curve, or another shape, compare one input-output pair at a time.
Find A Mismatch Systematically
A mismatch becomes easier to identify when you keep two representations as evidence for the third. Suppose the equation and table above remain unchanged, but the graph shows these points:
The first two points agree with the equation and table. At , however,
so the required point is , not . The graph is therefore the inconsistent representation.
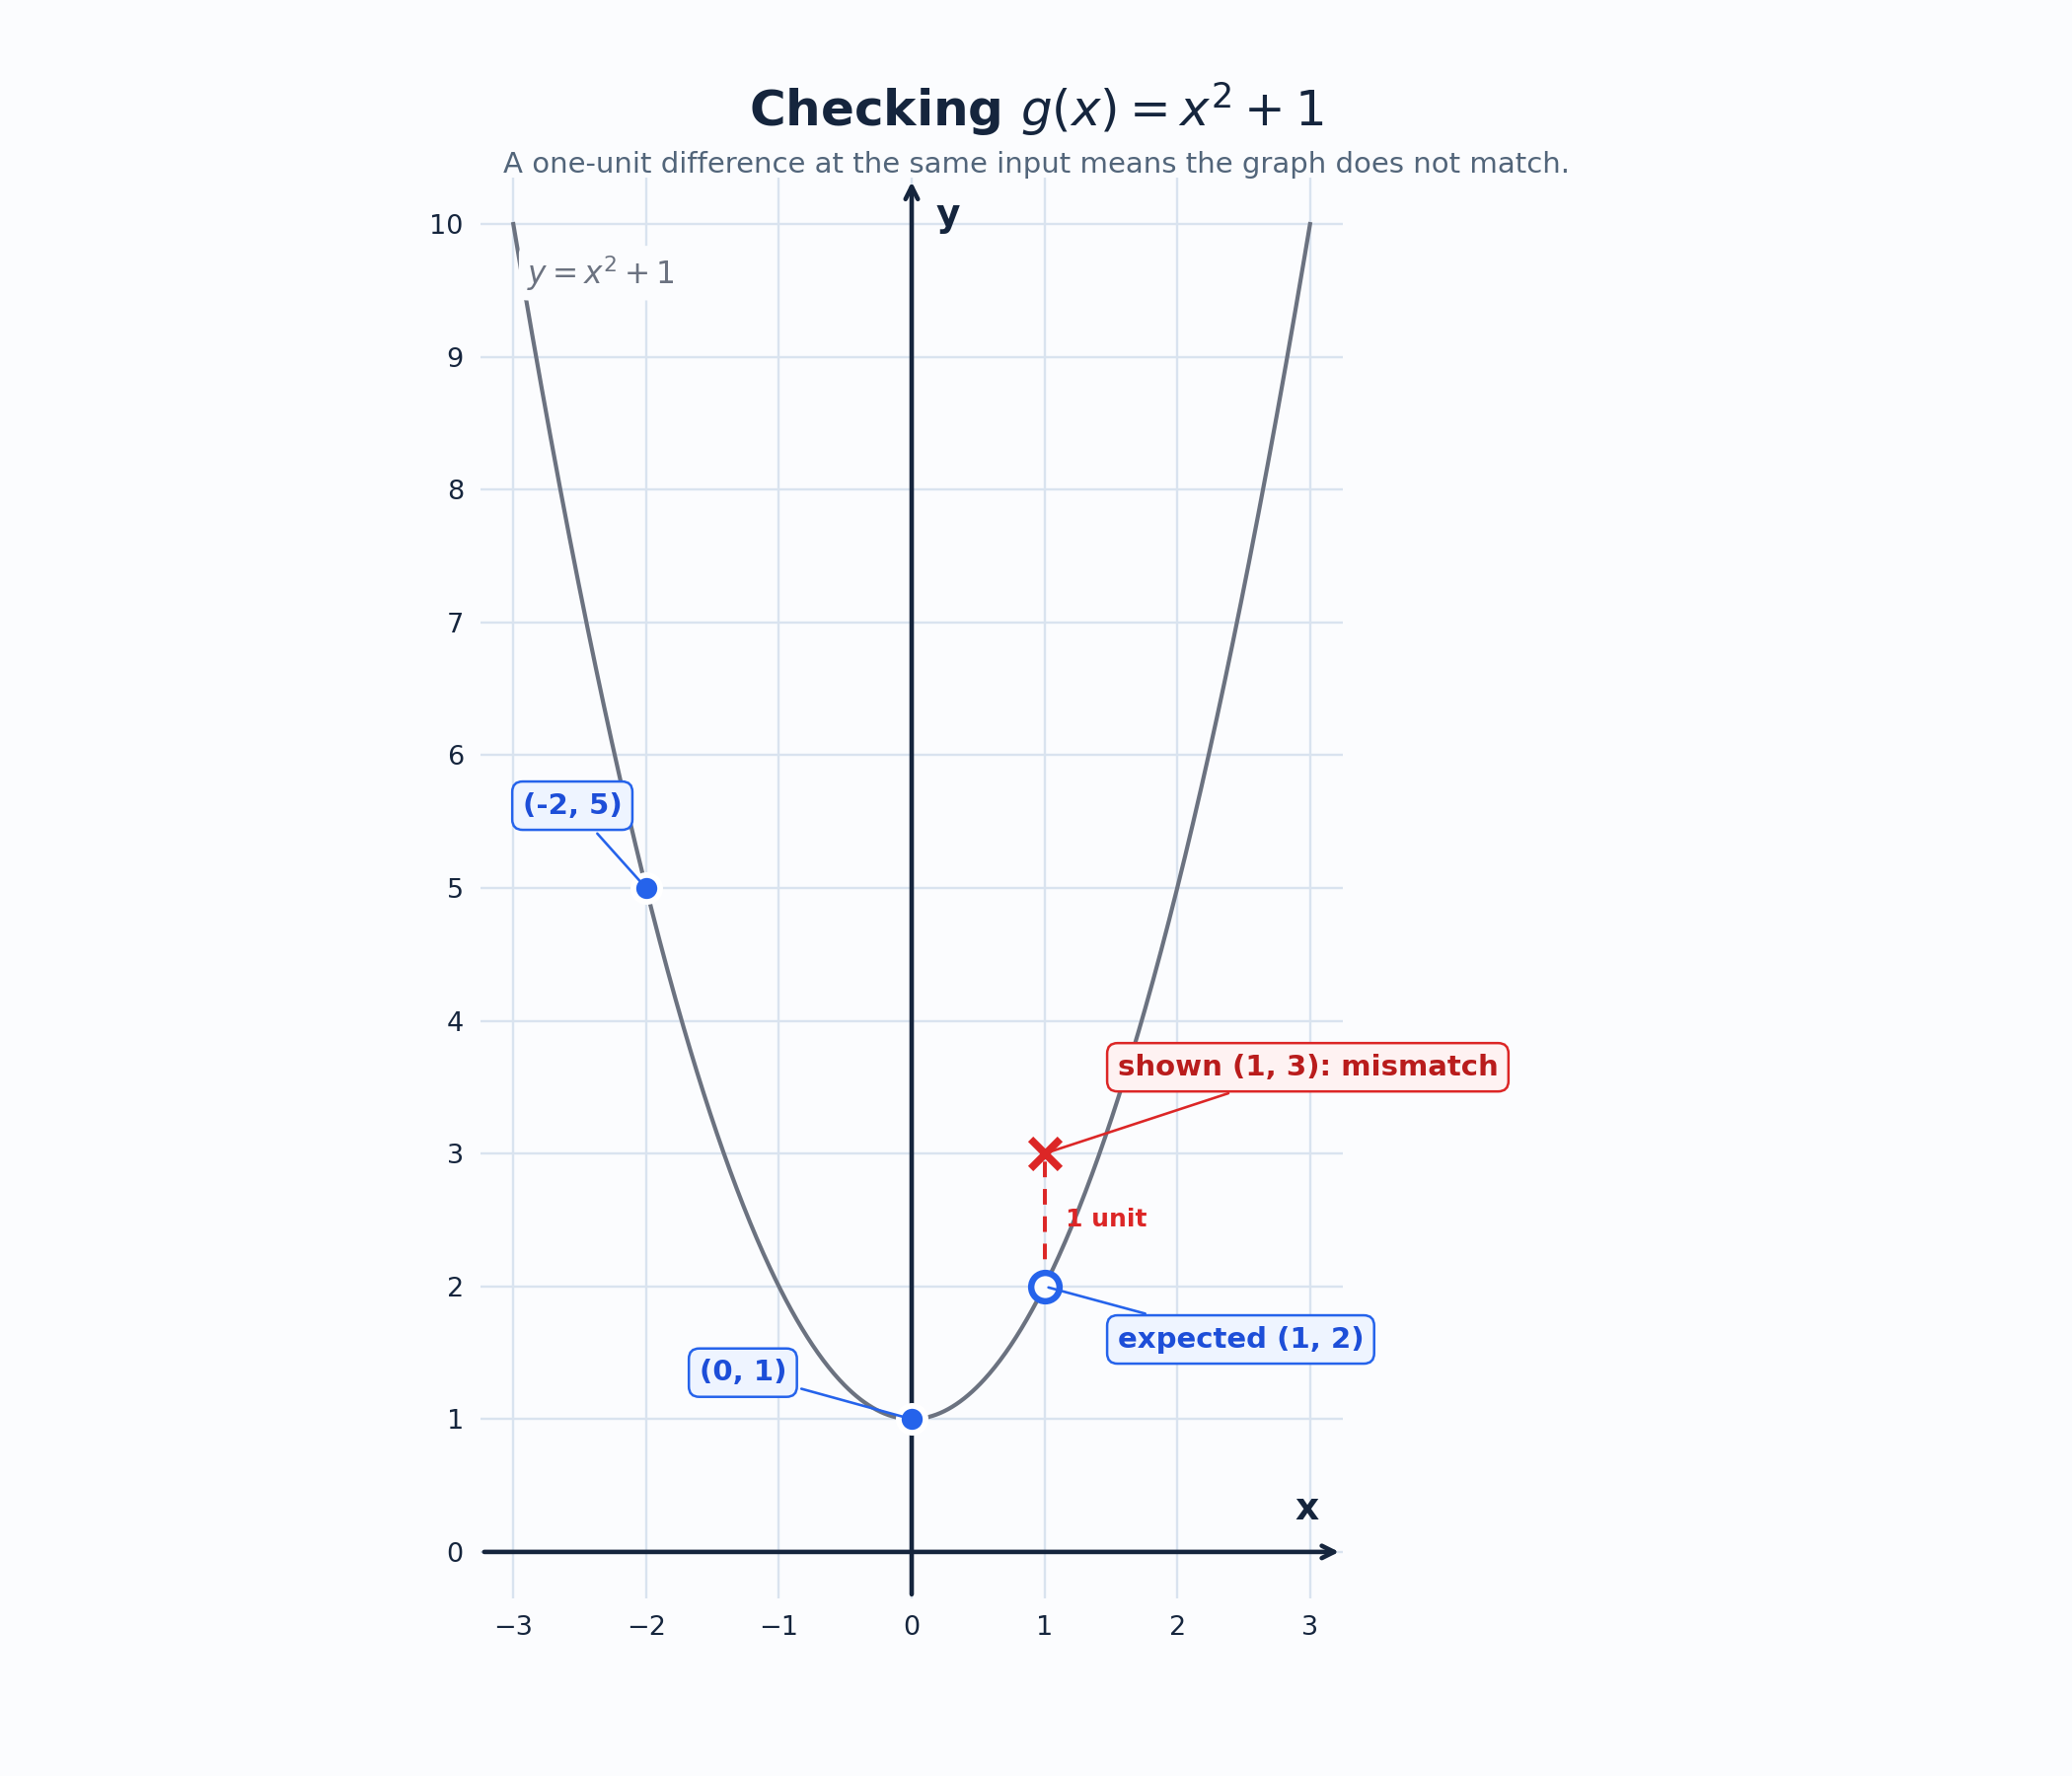
To identify a mismatch without guessing, follow this evidence trail:
- Read every input listed in the table.
- Use the equation to calculate the expected output for each input.
- Write each table row as its required ordered pair.
- Check whether the graph contains every required point or passes through it.
- If two representations agree and the third does not, identify the third as inconsistent. If only two representations are available and they disagree, conclude that they are inconsistent but do not assume which one contains the original error.
Common Mistakes To Avoid
| Common mistake | Better check |
|---|---|
| Reversing the coordinates | Write every pair as : input first, output second. |
| Using the output as the input | For , substitute into the equation and compare the result with . |
| Checking only one row | Test every input listed in the table. |
| Misreading the graph scale | Check how much each grid interval represents before reading a coordinate. |
| Accepting a nearby point | Compare exact coordinates; does not equal . |
| Relying only on graph shape | Two lines or curves can have different outputs at the same input. |
| Rejecting every extra graph point | A table may show selected inputs, so focus first on its listed pairs. |
A careful check keeps the input, output, and graph location connected in the same row. This prevents a correct output from being paired with the wrong input.
Conclusion And Next Steps
An equation, value table, and graph are three ways to record one input-output relationship. To test their agreement, evaluate the equation at each listed input, compare the result with the table, and locate the ordered pair on the graph. One mismatching pair is enough to show that the representations do not all agree.
In the practice that follows, you will match equations to tables, verify plotted points, plot a table yourself, and identify one inconsistent representation. Work row by row and use exact coordinates rather than visual closeness. This evidence-based habit will prepare you to compare and interpret more complex graphs later.
